Proof, not promises: this is Nova, the running project - the diagram below is live mermaid source, rendered by mermaid.js the moment you loaded this page. Flip it to Code. Copy it. That is the whole course in one block.
flowchart LR
  ev[App events] -->|stream| ing[Ingestion]
  crm[CRM export] -.->|nightly| ing
  ing --> qa{Quality checks}
  qa -->|pass| dw[(Warehouse)]
  qa -->|fail| dlq[Quarantine]
  dw --> bi[Dashboards]
  dw --> ml[ML features]
Draw with text: diagrams as code
Why typed diagrams beat dragged ones, flowchart fundamentals, and your first diagram rendering in GitHub and Notion.
🗺️ Session 2 · easyTame the spaghetti: flowchart mastery
Subgraphs, styling classes, click links, and big-diagram hygiene - Nova's full architecture map takes shape.
💬 Session 3 · mediumWho calls whom: sequence and state
Sequence diagrams for conversations between systems, state machines for lifecycles - the runtime side of Nova.
🗄️ Session 4 · mediumSchemas that speak: ER and class diagrams
Crow's foot cardinality you can actually read, the Nova warehouse model, and class diagrams for when structure is code.
📅 Session 5 · hard(er)Six diagrams for humans
Gantt, timeline, kanban, gitgraph, journey, mindmap - a breadth session for the work AROUND the system.
🎨 Session 6 · hardestMake it yours: the pro layer
Theming (how this course got pink), architecture and C4 diagrams, CLI exports in CI, accessibility, embedding everywhere.
Choose your path 🗺️
Everyone starts at Session 1 - the fence and the fundamentals live there. After that, follow your work.
The deep-dive track 🔬
Mermaid ships ~29 diagram types and half are experimental - the sessions teach the stable daily drivers deep, and these three self-paced pages cover the adventurous rest plus the power config.
The knowledge map 🧠
The whole course at a glance - hover a session to spotlight its concepts, click any node to jump in.
The whole course on one sheet 📐
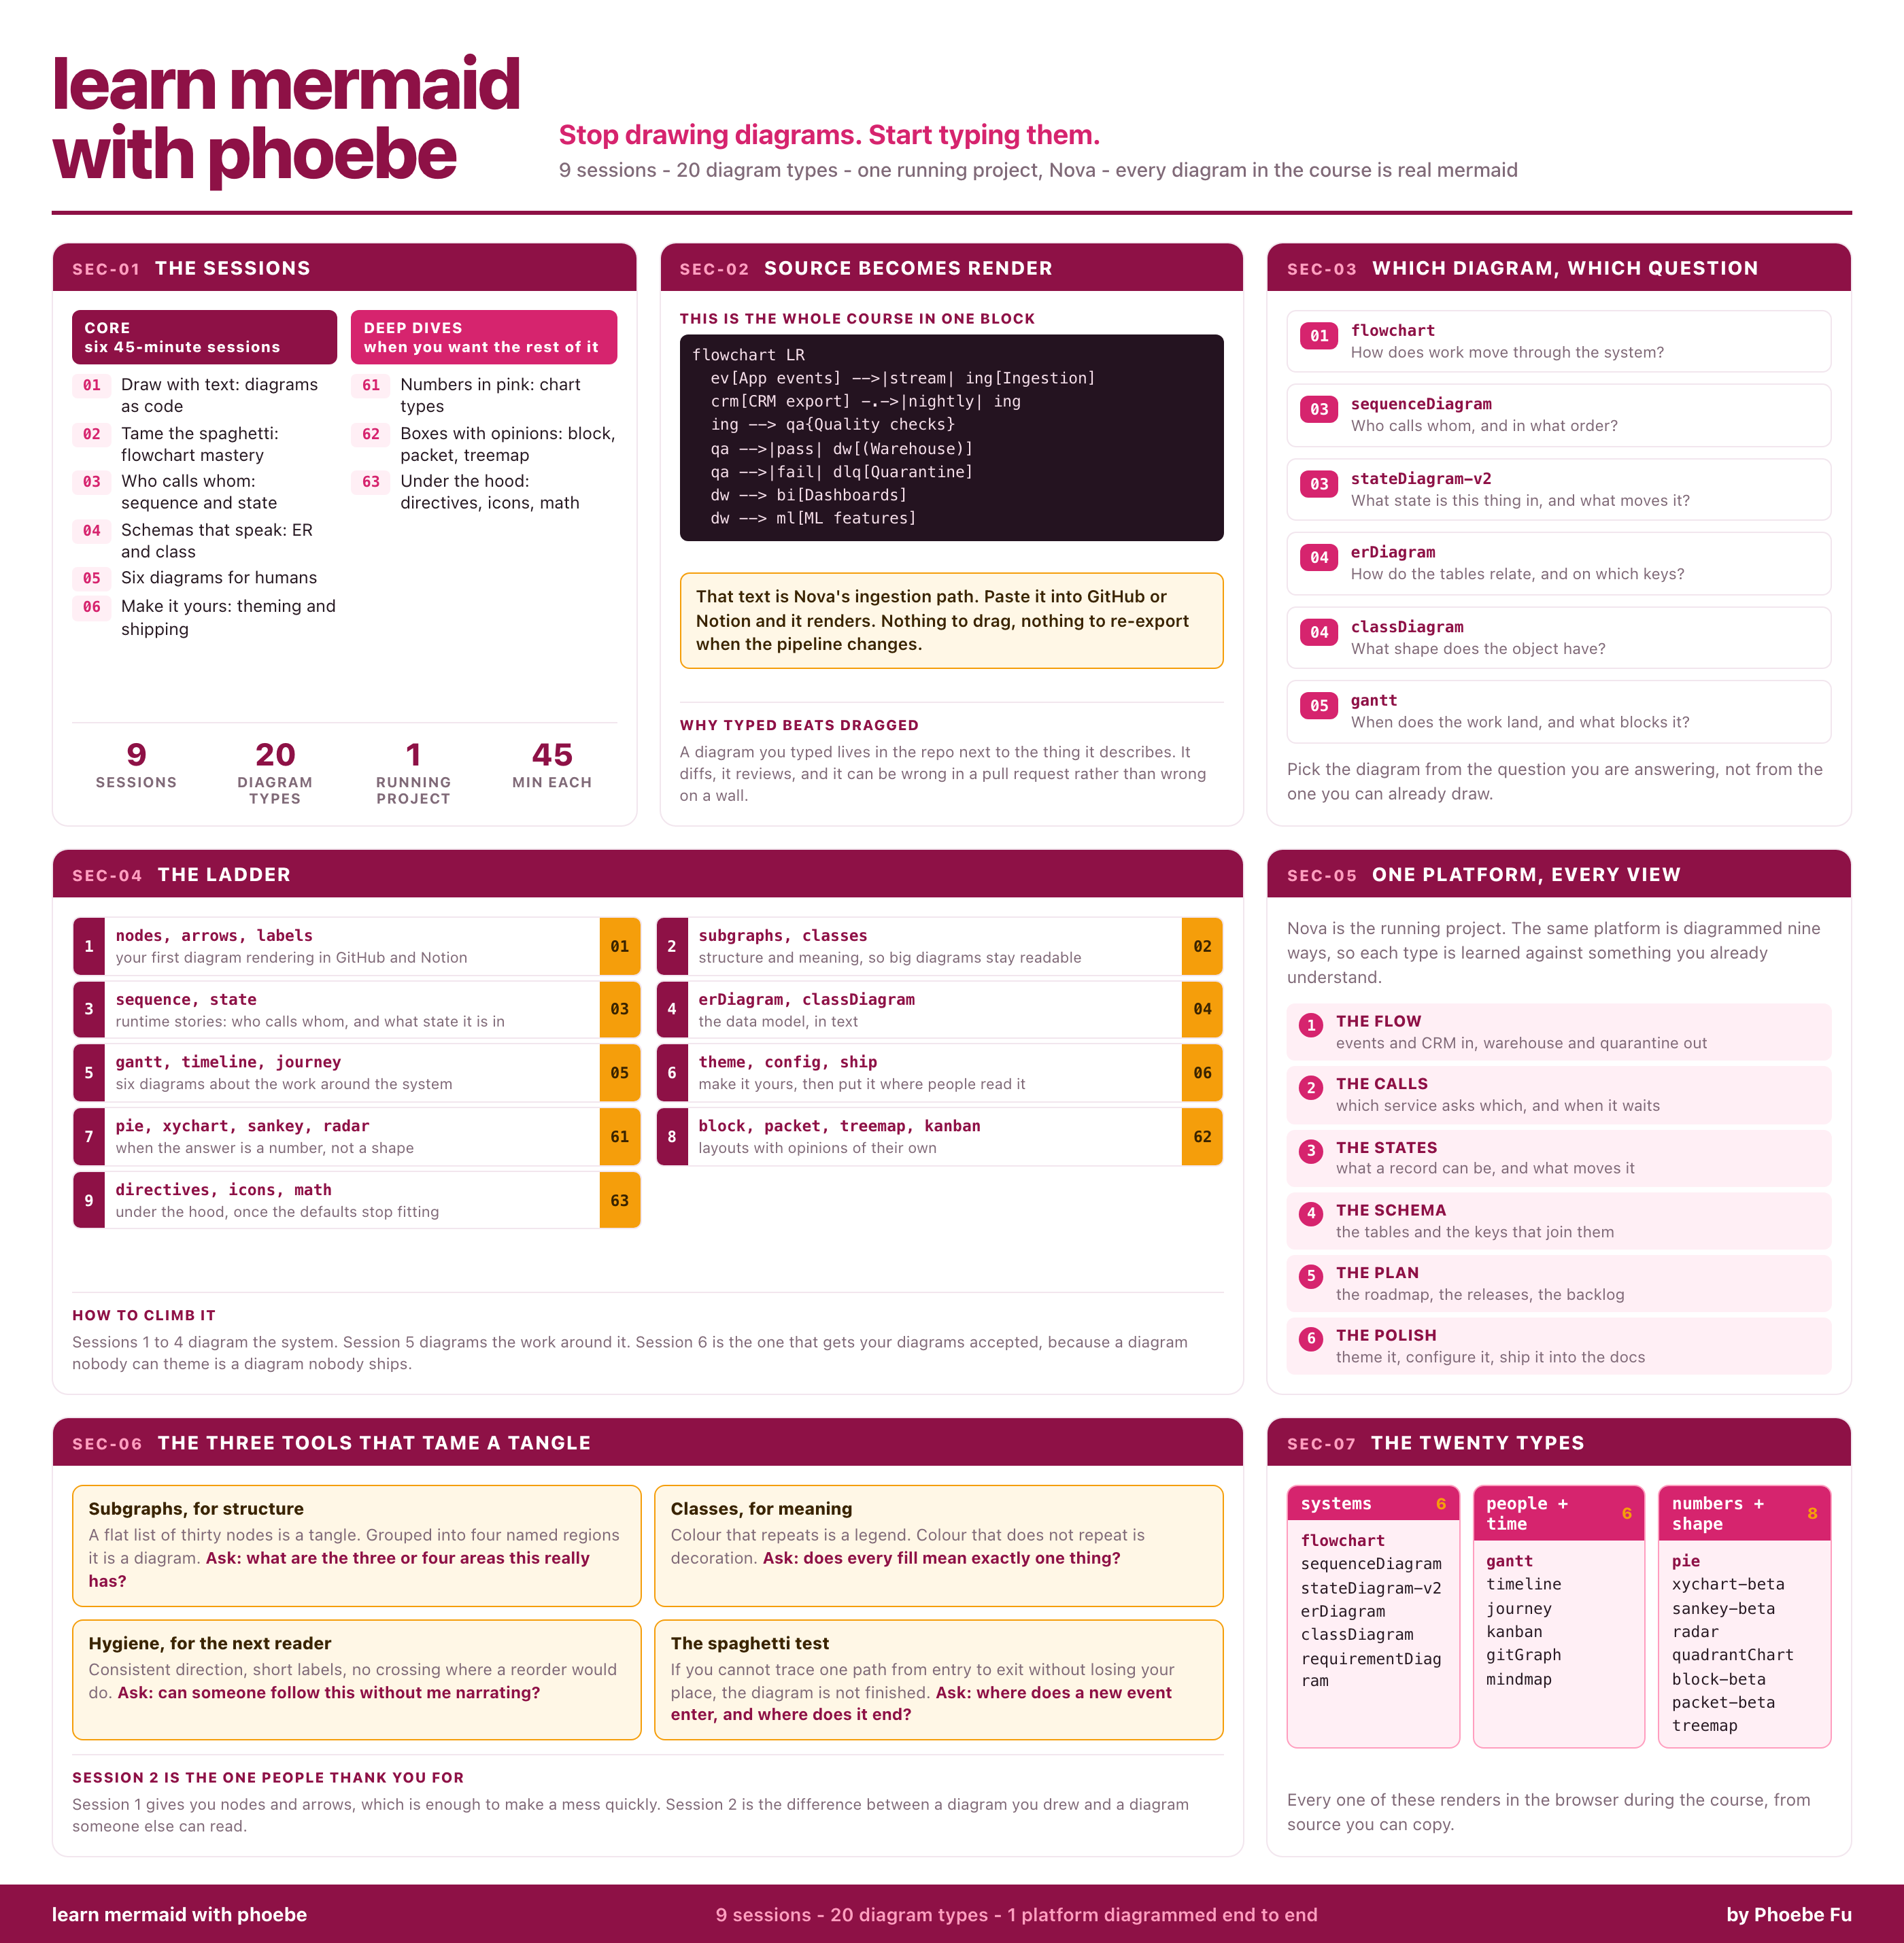
Seven modules: the six core sessions and three deep dives, the source-becomes-render idea the whole course rests on, which diagram answers which question, the twenty types mermaid ships, the three tools that tame a tangle, and Nova diagrammed end to end.
learn mermaid
with phoebe
SEC-01 THE SESSIONS
CORE
six 45-minute sessions
- 01Draw with text: diagrams as code
- 02Tame the spaghetti: flowchart mastery
- 03Who calls whom: sequence and state
- 04Schemas that speak: ER and class
- 05Six diagrams for humans
- 06Make it yours: theming and shipping
DEEP DIVES
when you want the rest of it
- 61Numbers in pink: chart types
- 62Boxes with opinions: block, packet, treemap
- 63Under the hood: directives, icons, math
SEC-02 SOURCE BECOMES RENDER
A diagram you typed lives in the repo next to the thing it describes. It diffs, it reviews, and it can be wrong in a pull request rather than wrong on a wall.
SEC-03 WHICH DIAGRAM, WHICH QUESTION
SEC-04 THE LADDER
Sessions 1 to 4 diagram the system. Session 5 diagrams the work around it. Session 6 is the one that gets your diagrams accepted, because a diagram nobody can theme is a diagram nobody ships.
SEC-05 ONE PLATFORM, EVERY VIEW
SEC-06 THE THREE TOOLS THAT TAME A TANGLE
Session 1 gives you nodes and arrows, which is enough to make a mess quickly. Session 2 is the difference between a diagram you drew and a diagram someone else can read.
SEC-07 THE TWENTY TYPES
systems6
- flowchart
- sequenceDiagram
- stateDiagram-v2
- erDiagram
- classDiagram
- requirementDiagram
people + time6
- gantt
- timeline
- journey
- kanban
- gitGraph
- mindmap
numbers + shape8
- pie
- xychart-beta
- sankey-beta
- radar
- quadrantChart
- block-beta
- packet-beta
- treemap