The leader track 🤝 · for execs, PMs & marketers · 6 x 45 min · no code
A statistic is only as good as the reading you give it. This track teaches you to interpret the numbers in any report - the center, the spread, the error bars, and the verdict - and to spot the fallacies that fool smart people, without opening a notebook. A friendly on-ramp for LinkedIn readers, too.
Reading the data
Mean, median, spread, and shape - and why the average is the most over-trusted number in business. Read a boxplot and a "typical customer" claim without being fooled.
🎲 Leader session 2Thinking in odds
Probability in plain language - independence, conditional probability, base rates and Bayes - and why a 99%-accurate test can still be wrong most times it fires.
🔔 Leader session 3The bell and its cousins
The normal curve and the 68-95-99.7 rule, plus the binomial (counts of yes/no) and the Poisson (events per period) - what each shape tells you at a glance.
🎯 Leader session 4What a sample can say
Why a sample of thousands can speak for millions - sampling error, the Central Limit Theorem, and the margin-of-error intuition behind every poll and dashboard.
📏 Leader session 5The number and its error bars
Point vs interval estimates, and what a 95% confidence interval really means - plus the three things people wrongly think it means. Why "3.2% ± 0.5" beats "3.2%".
⚖️ Leader session 6Real or noise?
The logic of a test, the p-value (defined correctly), significance vs importance, and the fallacy gauntlet - p-hacking, Simpson's paradox, correlation vs causation. Capstone: read a Lumen A/B result like an exec.
The builder track 🛠️ · for practitioners · 10 x 45 min · Python
For DA, DE, DS, and anyone who needs the statistics under machine learning and experimentation. One running brand - Lumen Skincare - carried across every session: describe it, simulate it, fit distributions to it, sample from it, estimate its parameters, and test hypotheses on it - all from scratch with numpy, scipy, and statsmodels.
Describe the data
Build the Lumen dataset once (seed 42), then center, spread, and shape in numpy/pandas - and why .describe() can quietly mislead you on skewed money.
Probability and simulation
Sample spaces, conditional probability and Bayes in code, and Monte Carlo simulation - watch the law of large numbers converge on Lumen's conversion rate.
🔢 Builder session 3Random variables, E and Var
Discrete vs continuous random variables, expectation and variance, covariance, and the pmf/pdf/cdf trio - expected revenue per session, from first principles.
🔔 Builder session 4Distributions in scipy
Normal, binomial, Poisson (and uniform, exponential, lognormal) via scipy.stats - pdf/pmf/cdf/ppf, Q-Q plots, and fitting the right shape to Lumen's data.
🎯 Builder session 5Sampling and the CLT
Sampling distributions, standard error, and the Central Limit Theorem demonstrated by resampling - watch skewed order values average into a normal. Plus the bootstrap.
🎛️ Builder session 6Estimation and MLE
Estimators, bias and consistency, why we divide by N-1, and maximum likelihood - derive it, then let scipy find the parameter that makes Lumen's data most probable.
📏 Builder session 7Confidence intervals
z and t intervals for a mean, Wald and Wilson for a proportion, and the bootstrap CI - build the interval on Lumen's conversion rate that sets up the A/B test.
⚖️ Builder session 8Hypothesis testing
Null vs alternative, the test statistic, p-value, Type I/II error and power - the one and two-sample t-test and the two-proportion z-test. Is 3.6% really above 3.2%?
🧮 Builder session 9Chi-square and ANOVA
Chi-square goodness-of-fit and independence (channel vs convert), one-way ANOVA across product categories, and the nonparametric fallback when assumptions break.
📈 Builder session 10Correlation, regression & fallacies
Pearson and Spearman, simple and multiple OLS, R-squared and residuals - then the fallacy capstone: p-hacking simulated, multiple comparisons corrected, Simpson's paradox in code.
Choose your path 🗺️
Leaders start at Leader session 1; practitioners start at Builder session 1. The fast-tracks fit a specific gap.
Try the statistics playground 🎛️
Three live tools, no install, seeded from Lumen's real numbers. Drag the dials and watch the math move - the same tools are embedded in the sessions that teach them.
The knowledge map 🧠
The builder track at a glance - hover a session to spotlight its concepts, click any node to jump in.
The whole course on one sheet 📐
Seven modules: both tracks, the three shapes almost every business number takes, what an honest error bar actually claims, the builder ladder from describing data to regression, which test to reach for, the six fallacies that fool smart rooms, and the Lumen checkout claim worked end to end.
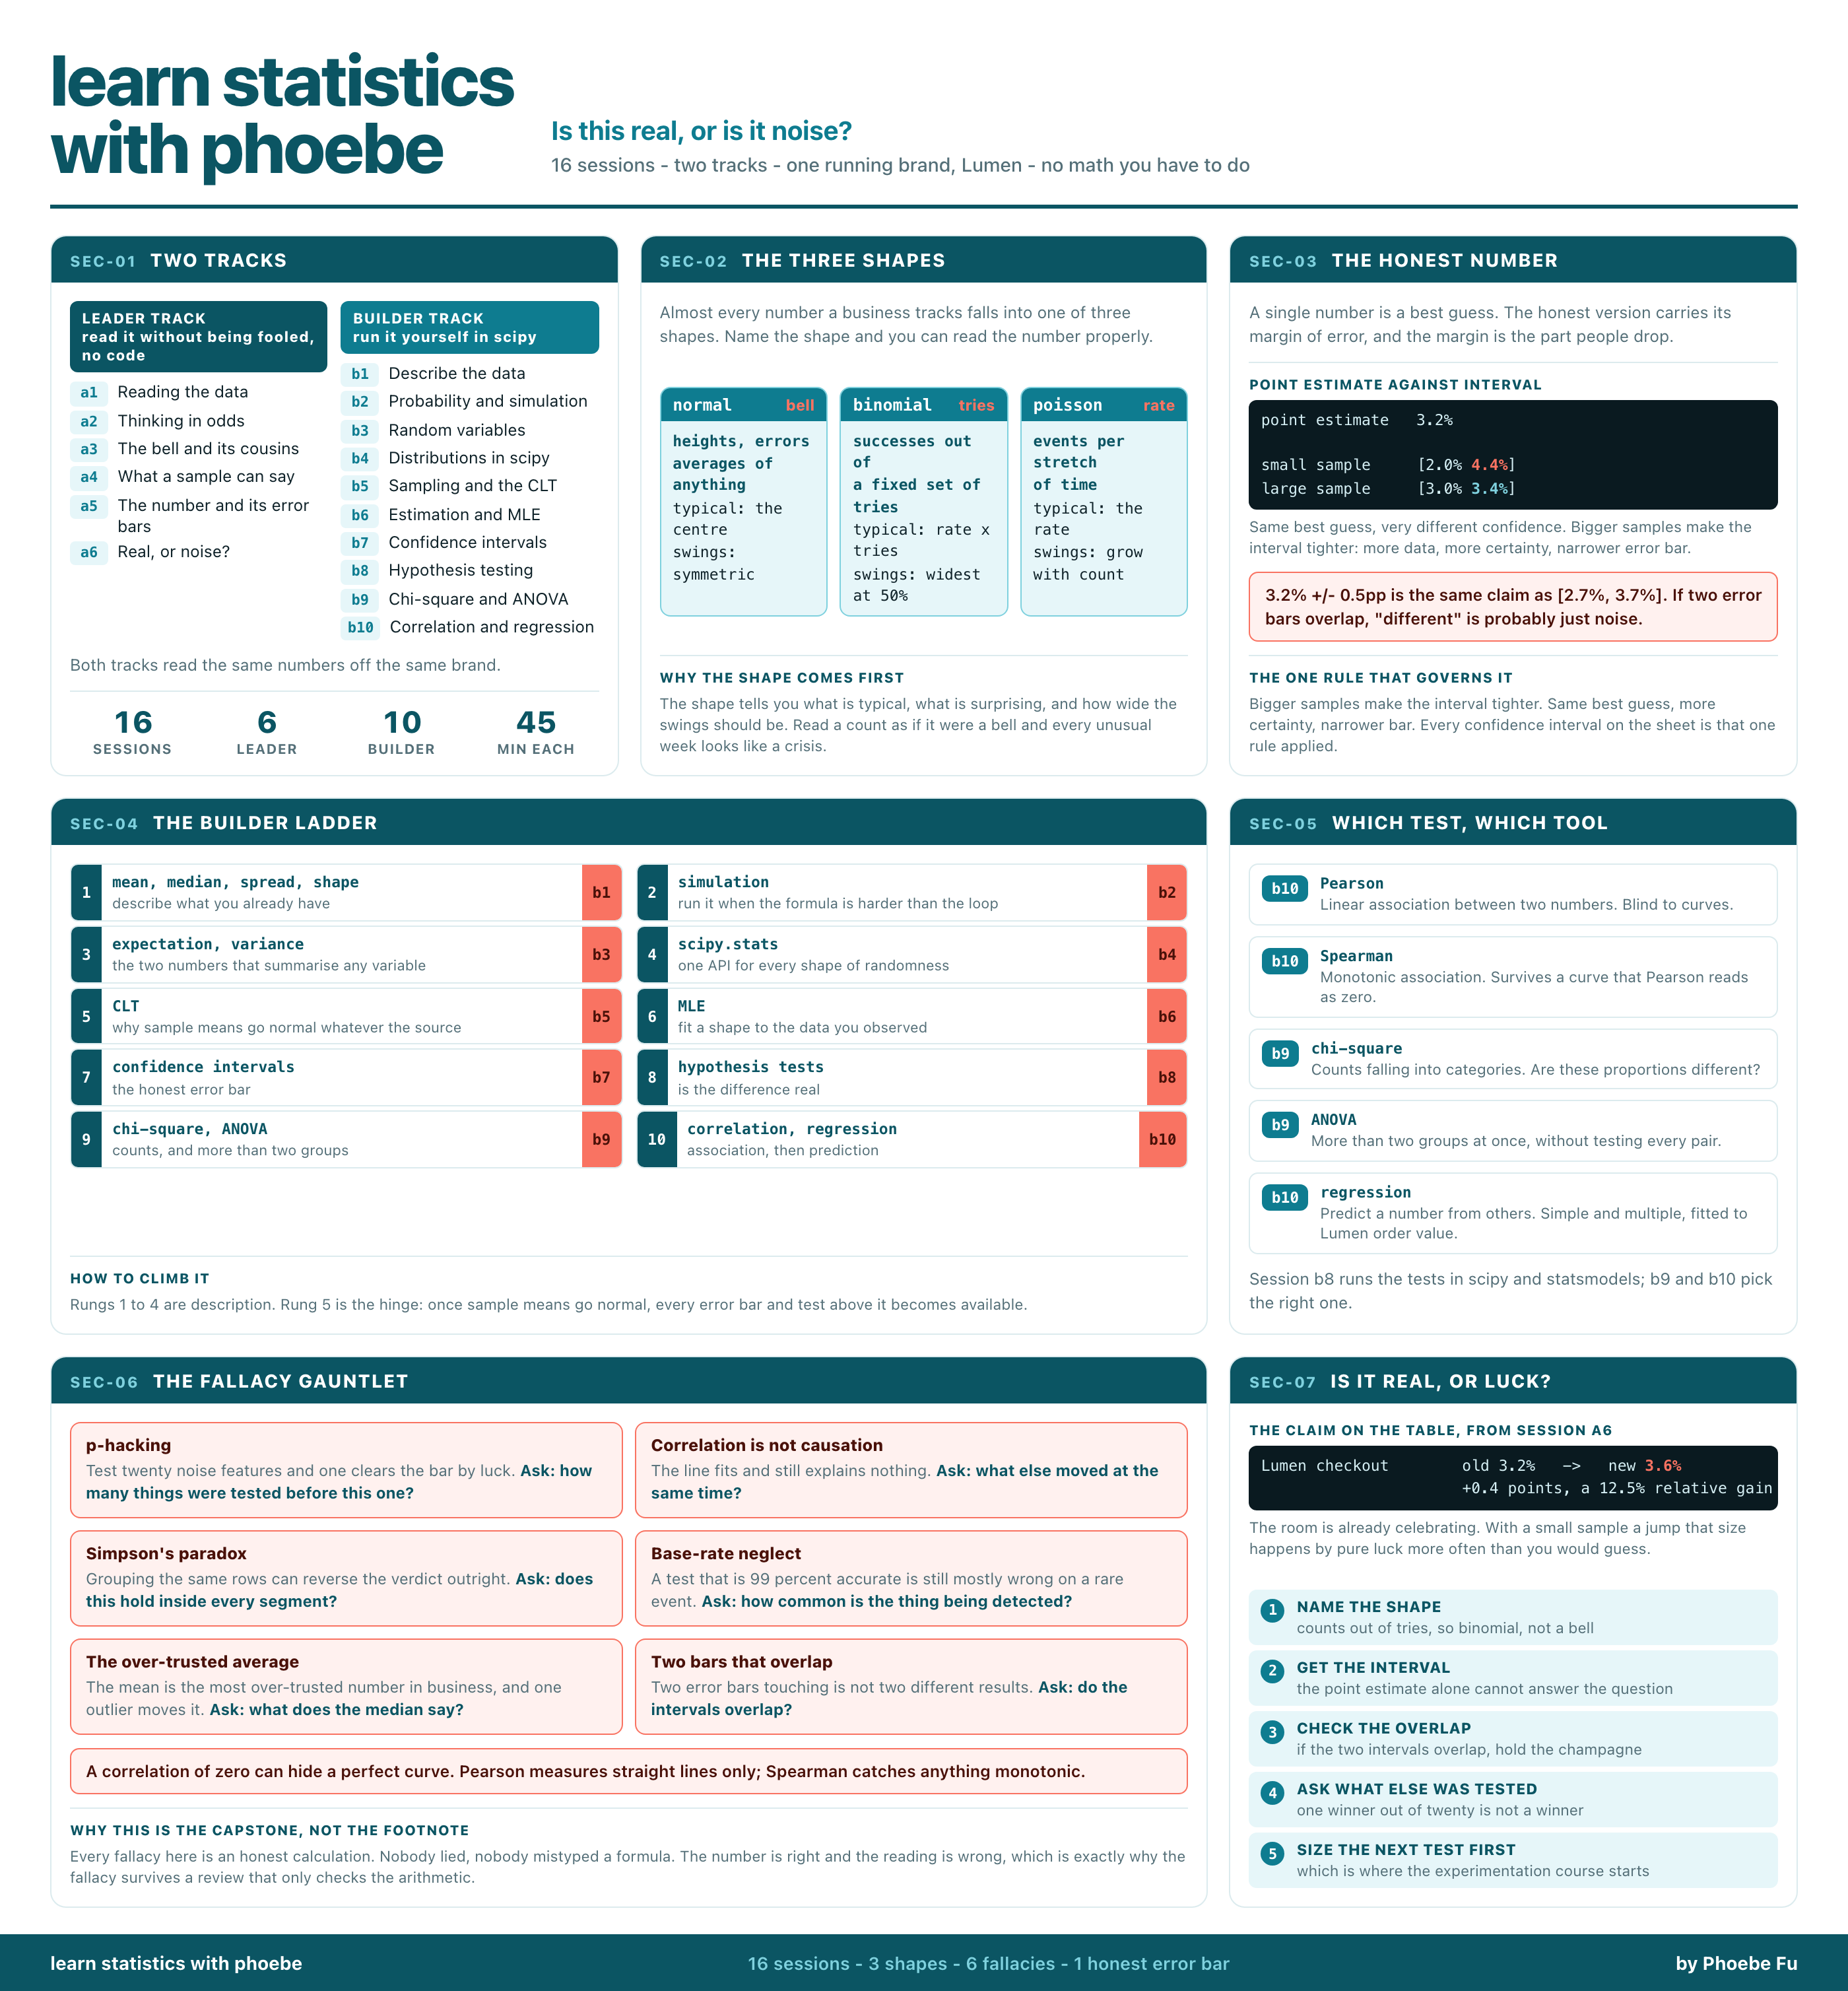
learn statistics
with phoebe
SEC-01 TWO TRACKS
LEADER TRACK
read it without being fooled, no code
- a1Reading the data
- a2Thinking in odds
- a3The bell and its cousins
- a4What a sample can say
- a5The number and its error bars
- a6Real, or noise?
BUILDER TRACK
run it yourself in scipy
- b1Describe the data
- b2Probability and simulation
- b3Random variables
- b4Distributions in scipy
- b5Sampling and the CLT
- b6Estimation and MLE
- b7Confidence intervals
- b8Hypothesis testing
- b9Chi-square and ANOVA
- b10Correlation and regression
SEC-02 THE THREE SHAPES
normalbell
- heights, errors
- averages of anything
- typical: the centre
- swings: symmetric
binomialtries
- successes out of
- a fixed set of tries
- typical: rate x tries
- swings: widest at 50%
poissonrate
- events per stretch
- of time
- typical: the rate
- swings: grow with count
The shape tells you what is typical, what is surprising, and how wide the swings should be. Read a count as if it were a bell and every unusual week looks like a crisis.
SEC-03 THE HONEST NUMBER
Same best guess, very different confidence. Bigger samples make the interval tighter: more data, more certainty, narrower error bar.
Bigger samples make the interval tighter. Same best guess, more certainty, narrower bar. Every confidence interval on the sheet is that one rule applied.
SEC-04 THE BUILDER LADDER
Rungs 1 to 4 are description. Rung 5 is the hinge: once sample means go normal, every error bar and test above it becomes available.
SEC-05 WHICH TEST, WHICH TOOL
SEC-06 THE FALLACY GAUNTLET
Every fallacy here is an honest calculation. Nobody lied, nobody mistyped a formula. The number is right and the reading is wrong, which is exactly why the fallacy survives a review that only checks the arithmetic.
SEC-07 IS IT REAL, OR LUCK?
The room is already celebrating. With a small sample a jump that size happens by pure luck more often than you would guess.