Everrest watches 15 daily revenue series. On Monday morning, which of last week's movements are real enough to act on, and what actually caused them? This page builds the monitor in the order that lets you answer that - baseline, then calibration, then multiplicity, then the threshold - and scores every rung against changes planted at known times, so recall is measured instead of claimed. The measured answer is not flattering, and it is on the page.
The marts hold a year of delivered orders across 8 categories and 6 regions. The obvious board is every combination - 48 slices plus a total - and it is the wrong board. Which series you watch is a monitoring decision with a right answer, and it is made before any threshold exists.
A z-score assumes a continuous quantity with a stable spread. Run one over a series that is empty on a sixth of its days and it manufactures alerts out of arithmetic - the model is simply wrong about what kind of number it is looking at. Those slices need a count model, which this skill does not ship, so they are excluded loudly rather than monitored badly. They come back in Step 5 for attribution, where the maths is exact arithmetic on sums and sparsity does not matter.
Two kinds of data are needed and they do different jobs. The real marts show what an on-call would actually have received. They cannot show what was missed, because nobody knows - so a second, simulated panel is fitted to the real one's seasonality, weekday shape and noise, and then changes of known size are planted in it at known times. That is the only place on this page where recall is a measured quantity.
600 order ids appear twice, all in March 2026. The join to order_items fans them out.
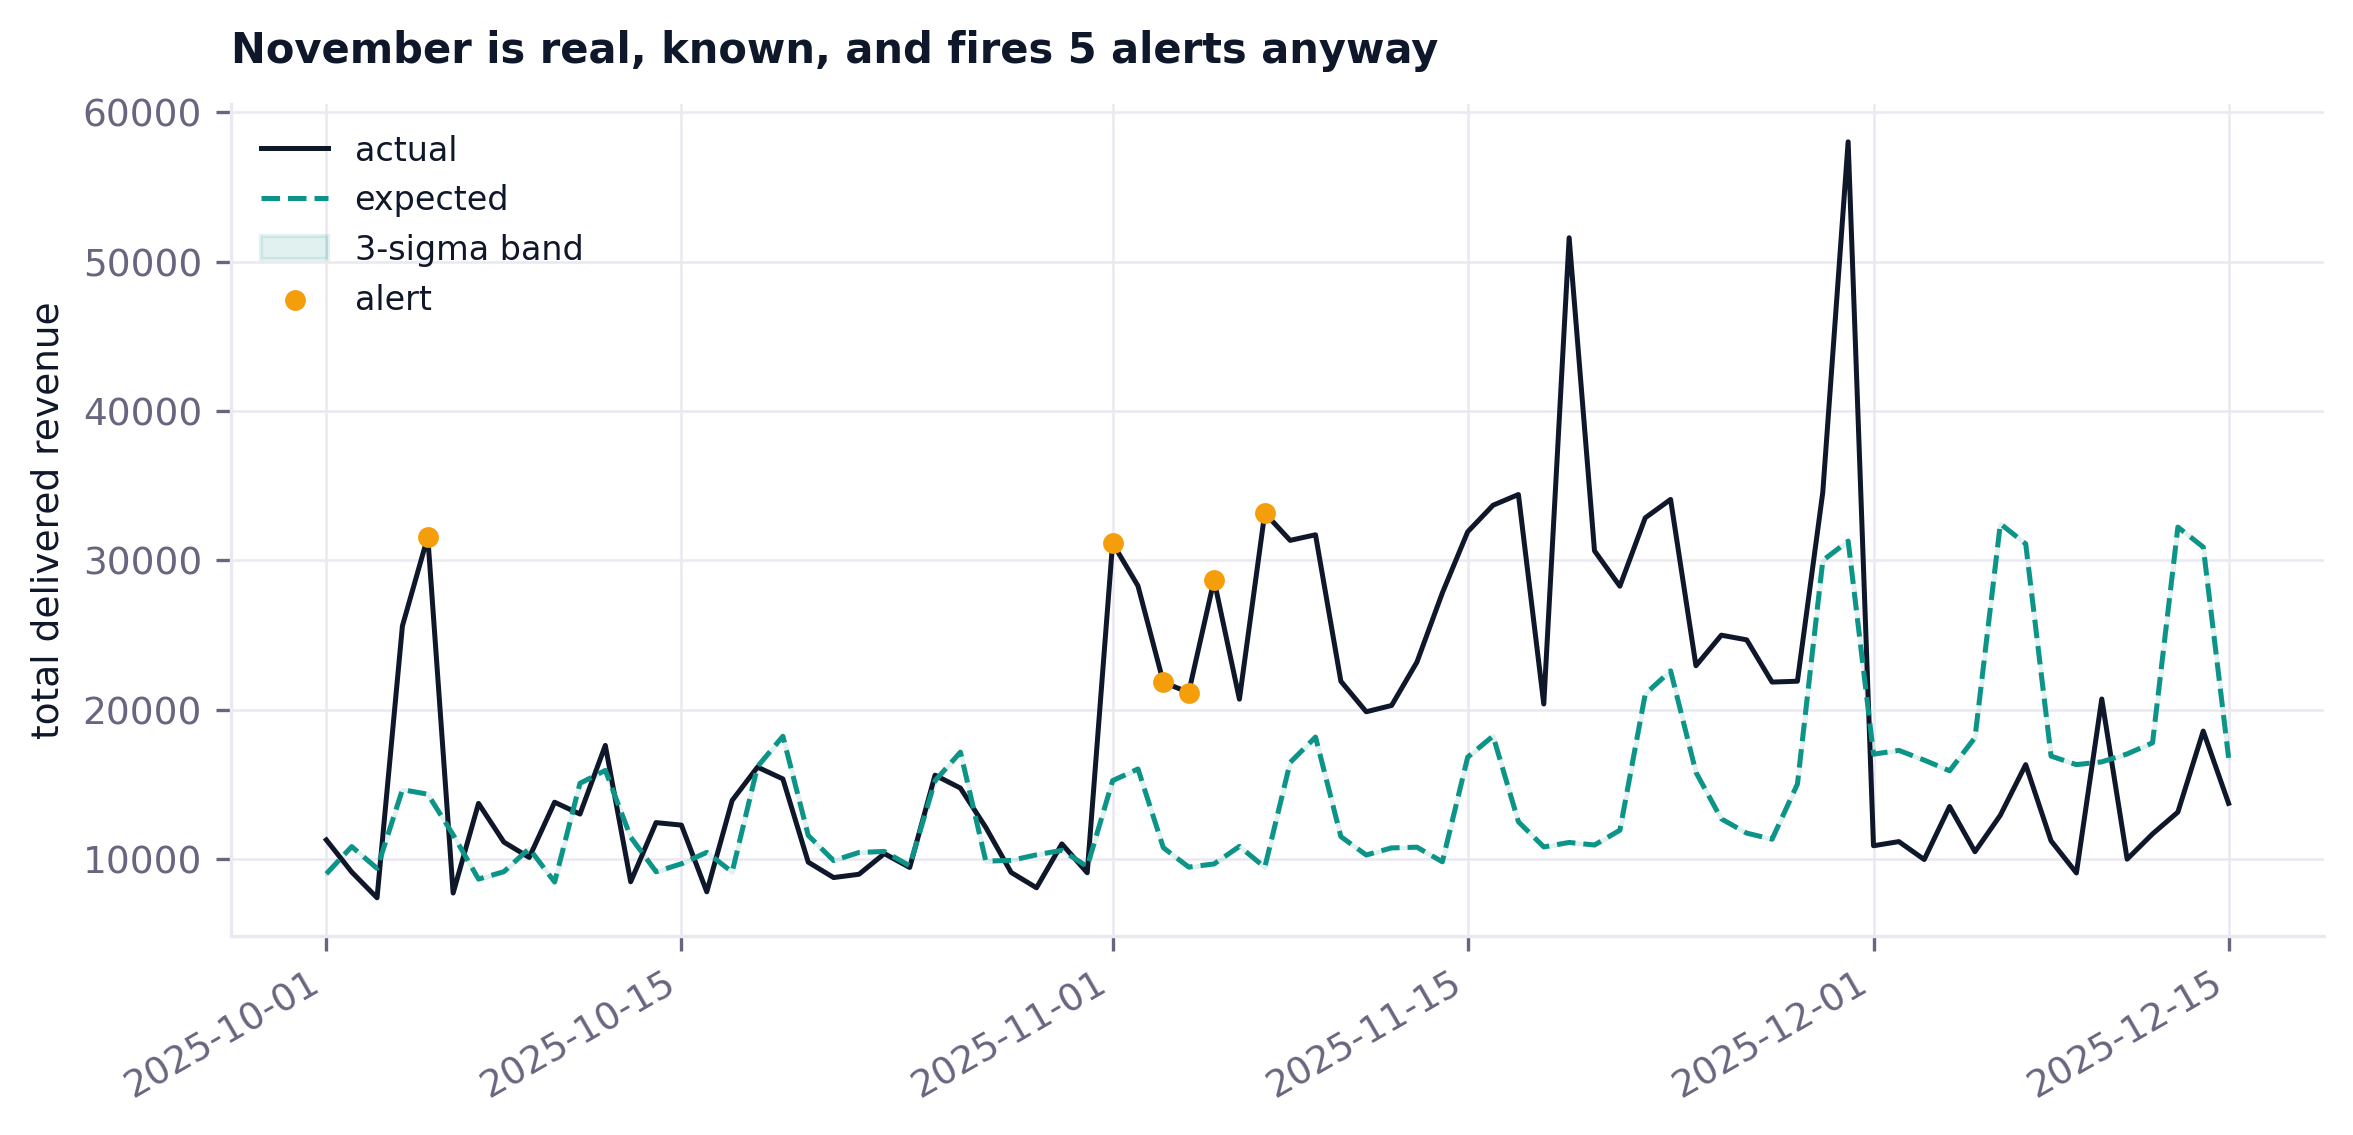
November runs about 2.2x baseline. Everybody in the business knew it was coming.
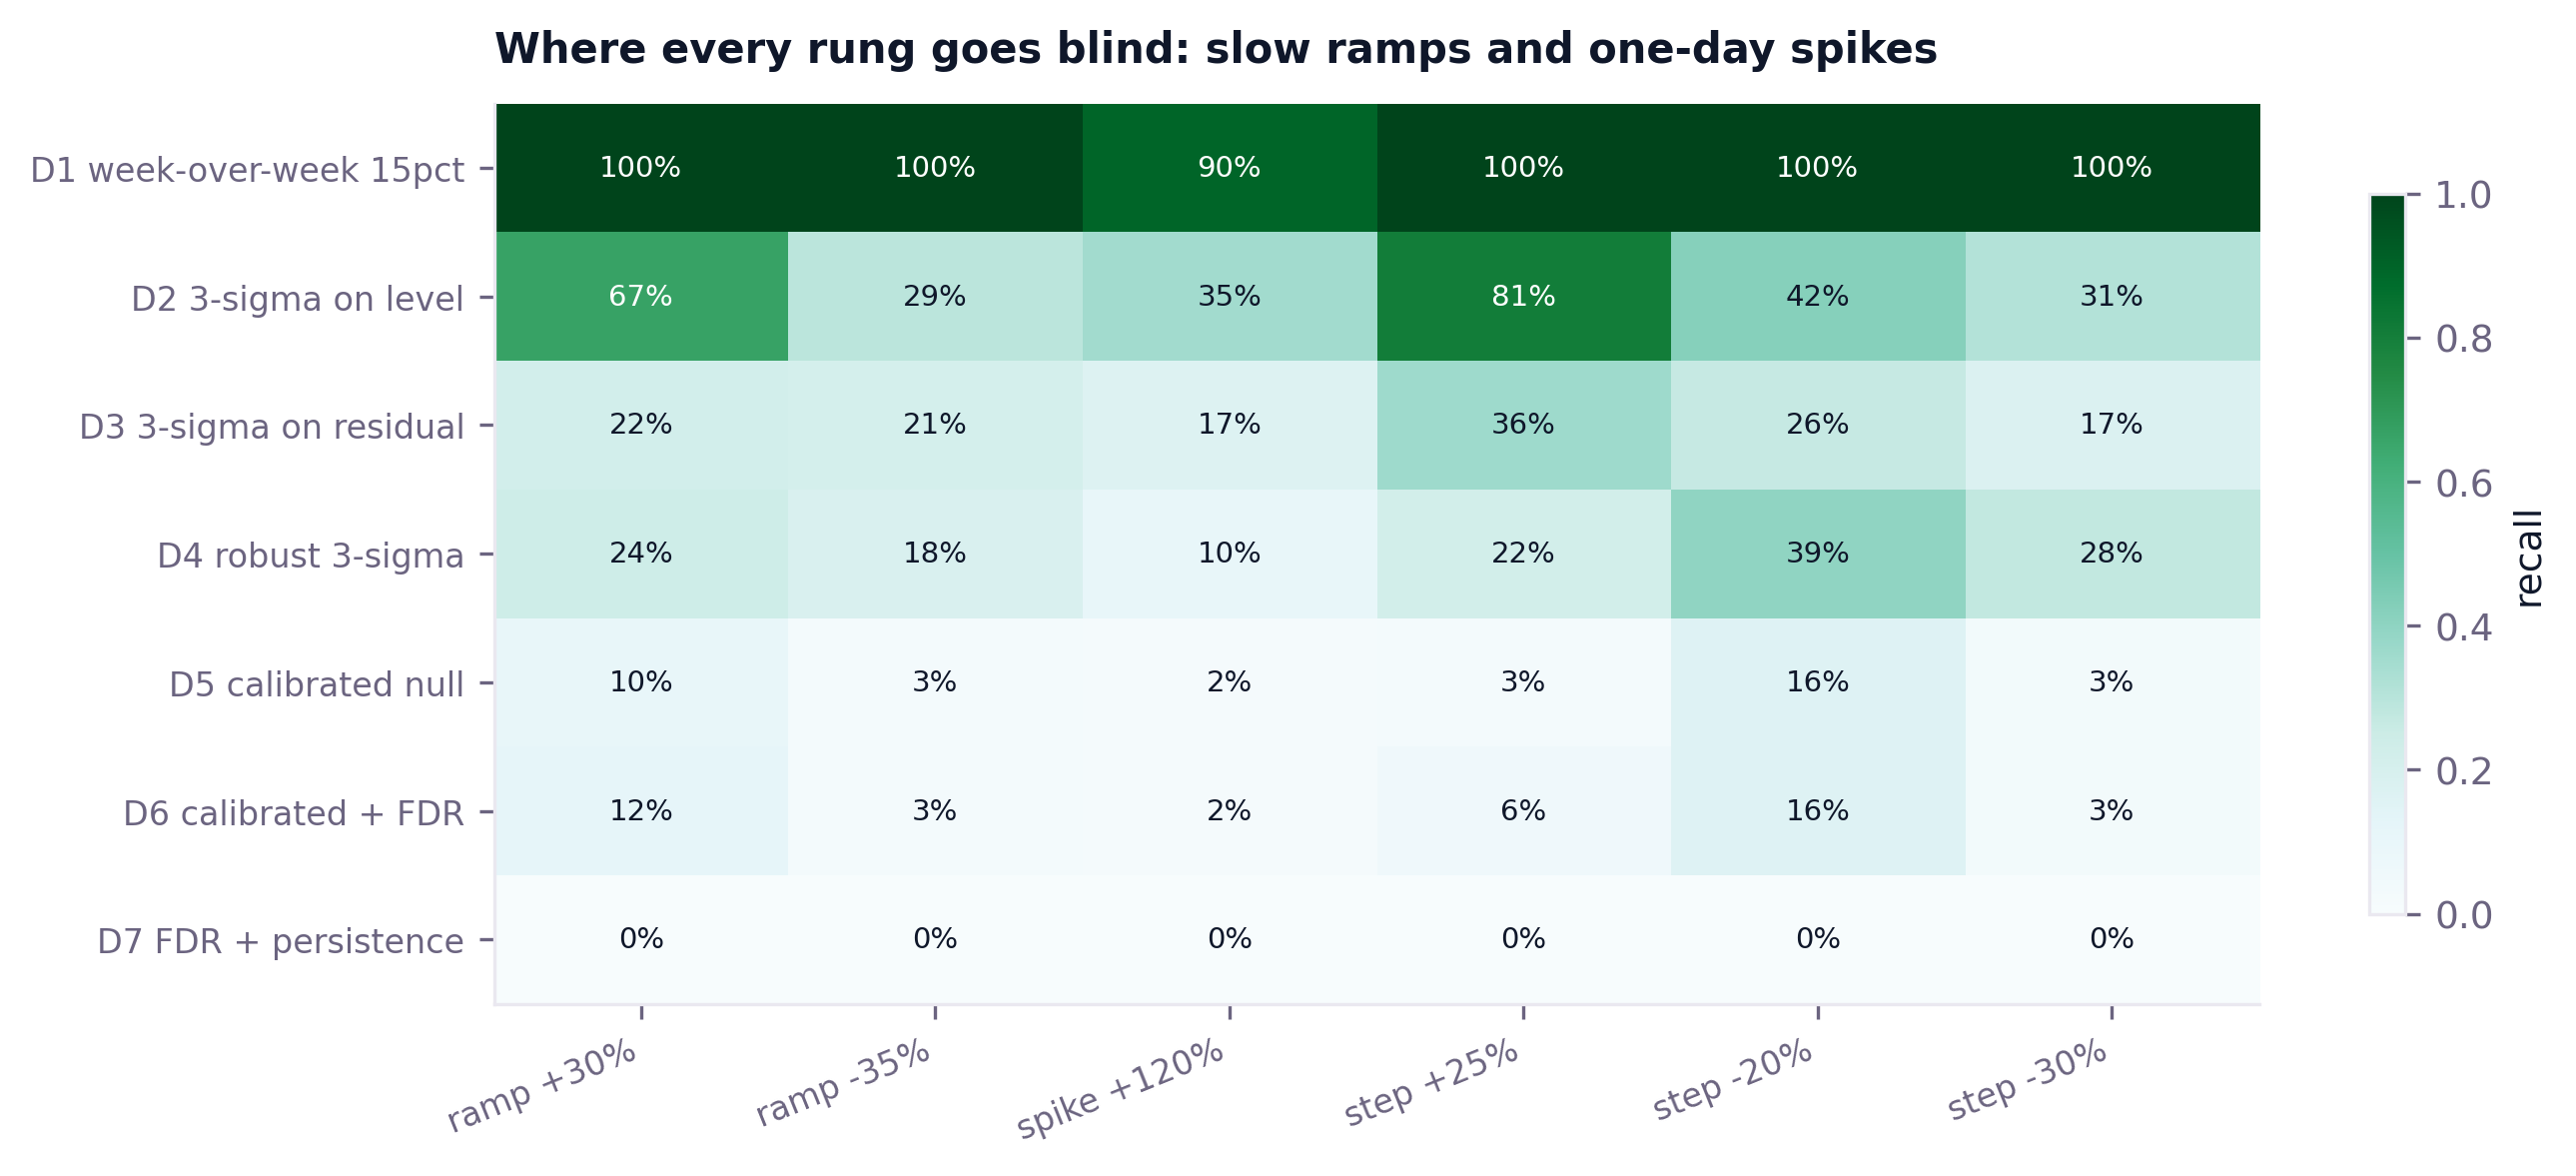
Level shifts of -30%, -20% and +25% over 45 days; ramps to -35% and +30% over 28.
A single day at +120%. A different detection problem from everything above it.
The items mart also holds 1,261 exactly duplicated rows, and deduplicating those looks like extra hygiene. It is not: order_items has no line-level key, so two identical lines on one order are a legitimate shape, and those rows are spread evenly across all twelve months at about one percent - tracking volume, not the March incident. Dropping them stripped $50,647 of real revenue from the year and contaminated the baseline the entire bench is fitted on. Only the duplicated order ids are the defect.
"Which of last week's movements are real enough to act on, and what actually caused them?"
Almost every anomaly-detection library available would have produced a working monitor faster. None of them would have produced a measured recall, which is the whole point, so the detectors here are written out in full and the libraries are used for the parts that are genuinely solved.
Student-t fitting for the empirical null, the normal survival function, and nothing else. The multiple-testing step is written out rather than imported so it can be tested against hand-computed cases.
The panel, the trailing windows, the exact decompositions. Every window is positional over a complete daily index.
The reconciliation gate that actually catches the March duplicate load. Step 5 shows why no threshold on a metric ever will.
Owns the metric definitions and the 11% take rate. This page reports GMV and says so, rather than inventing a second definition of revenue.
seasonal_decompose is centered by default, which puts the day under test inside its own expectation. Step 5 measures what that costs instead of asserting it.
A better forecast is not the bottleneck here. The bottleneck is that a 30% drop is smaller than one day of noise, and no forecaster fixes that.
One script runs everything: the ladder on the real year, the ladder against planted truth, the cadence measurement, and the attribution. Every number below comes out of that run.
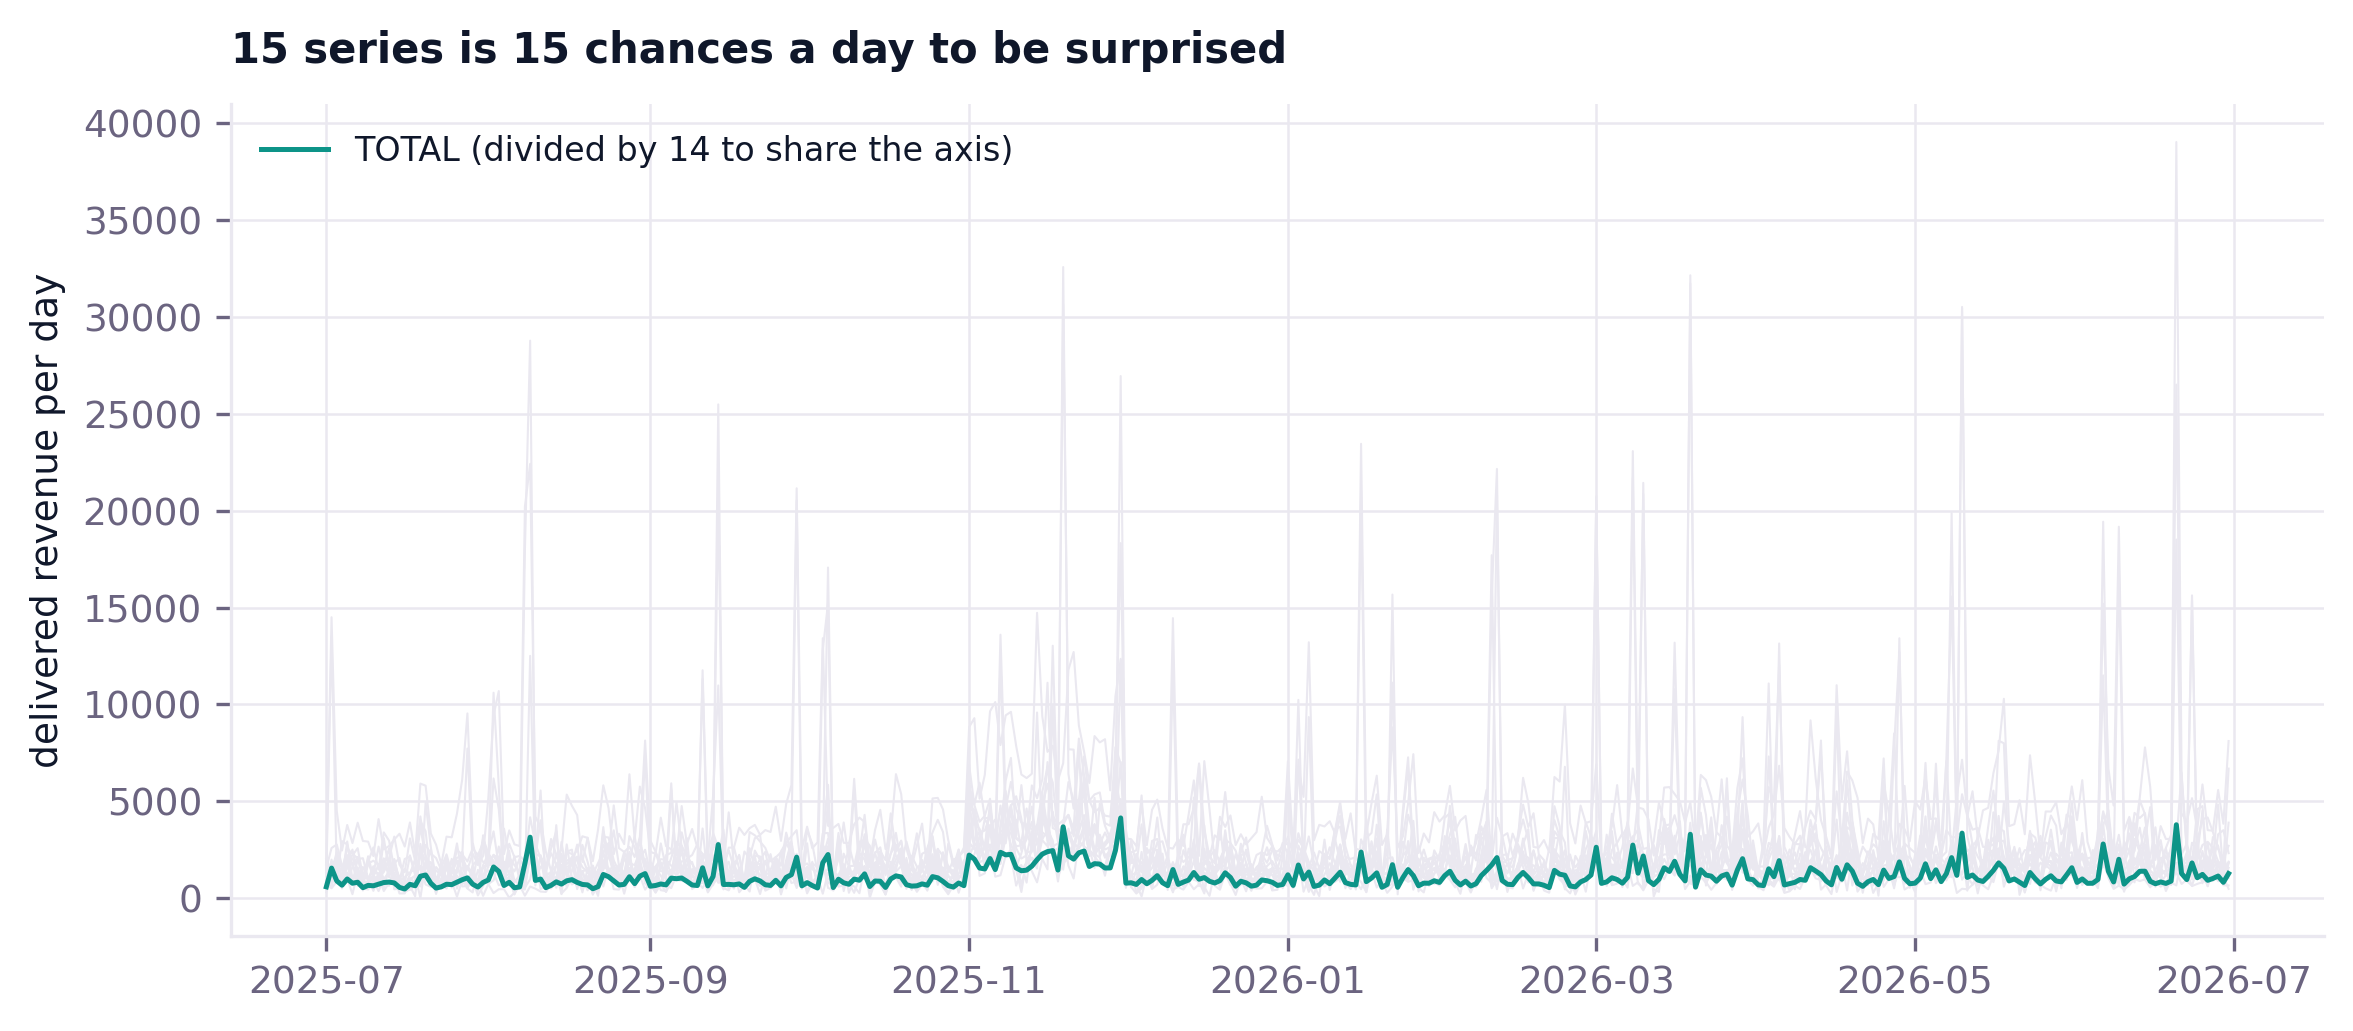
15 series is 15 chances a day to be surprised, and a percent-change rule takes every one of them.
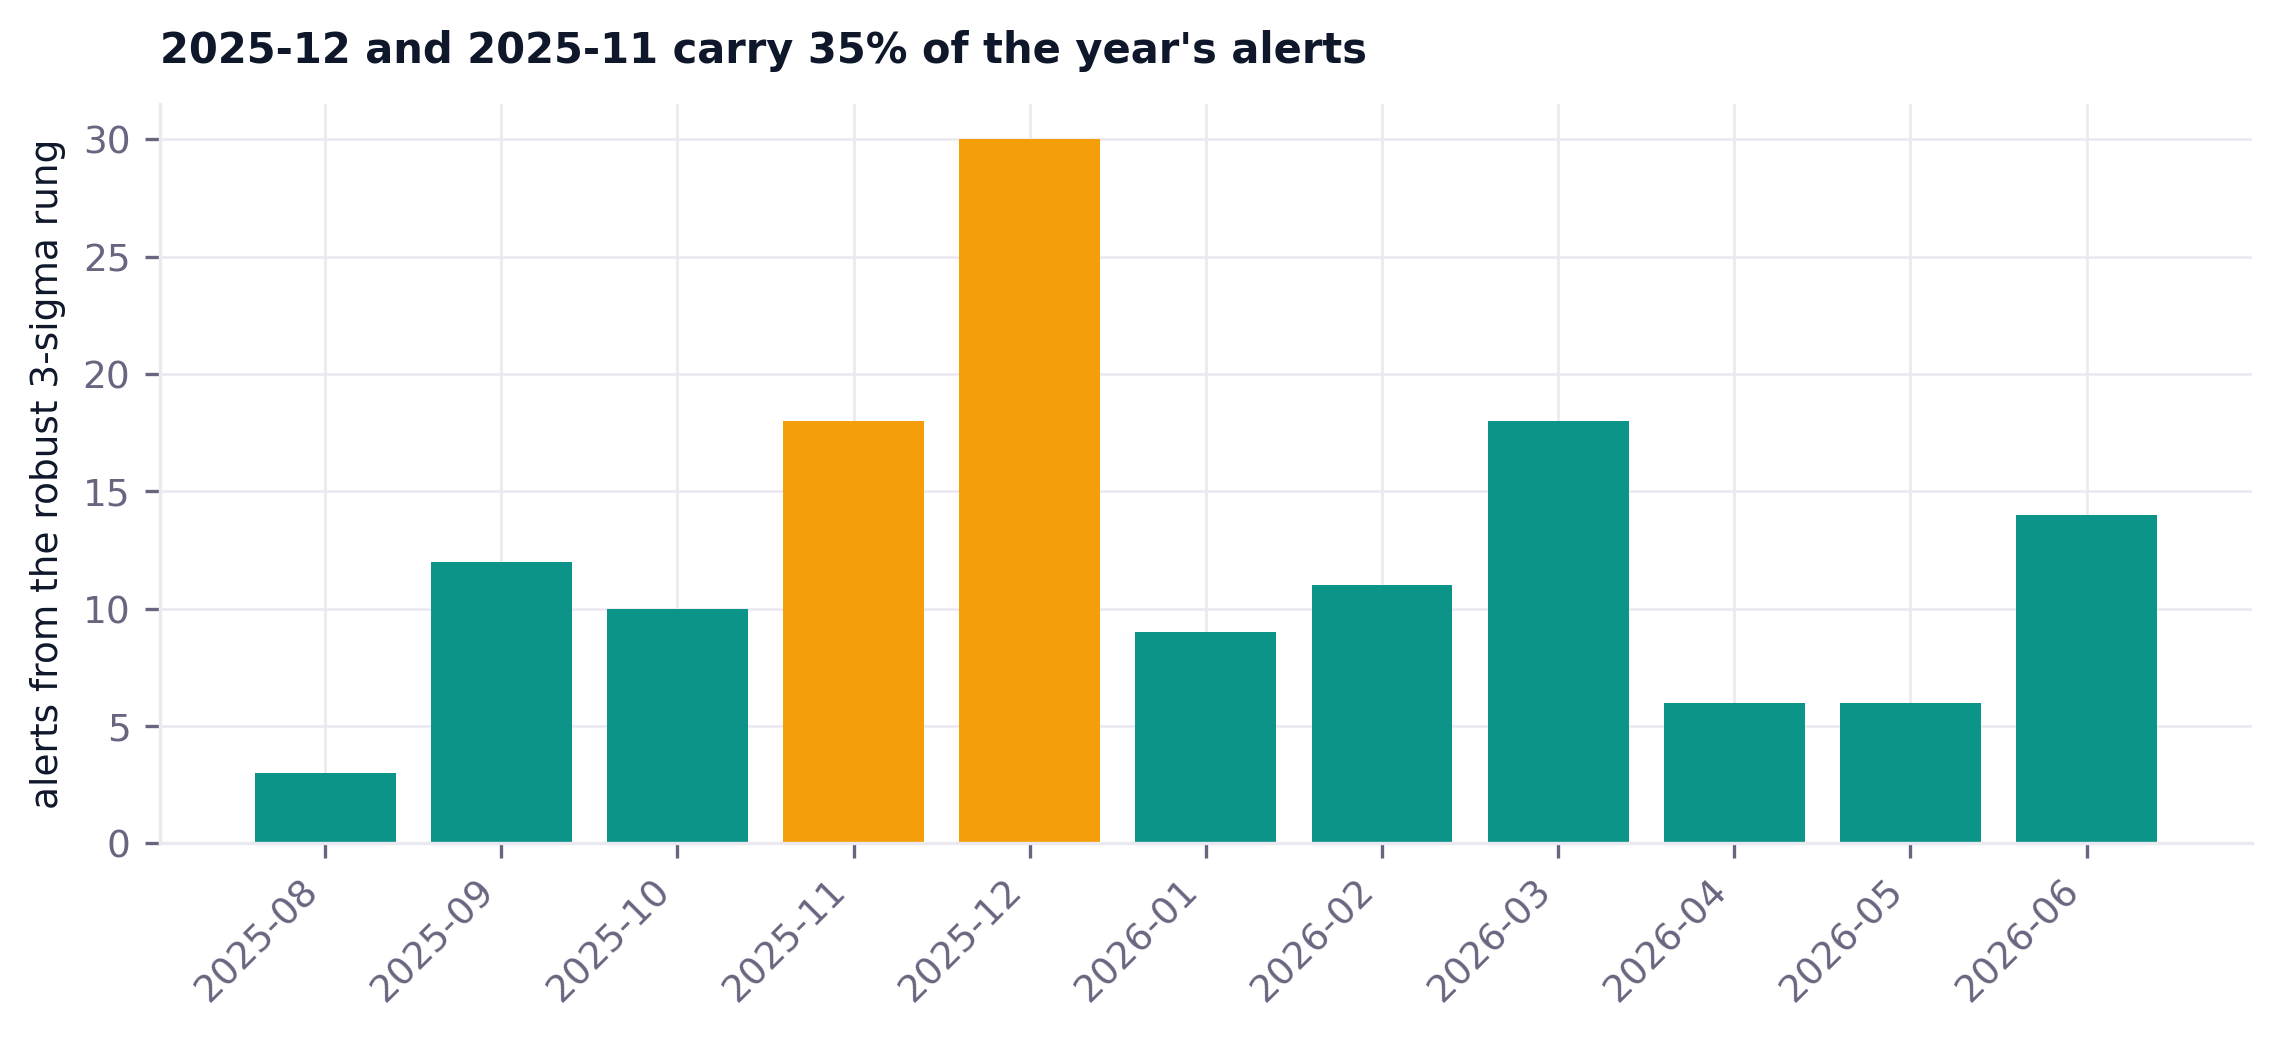
The March duplicate load inflated the month by $125,738 of GMV - 18 percent of the month as booked. It lands on all 31 days at a median 24 percent, so it is a sustained uniform shift rather than a spike, and the baseline simply learns it. Removing the duplicates moves March from 18 alerts to 18 on the robust rung, and 15 to 13 on the FDR rung. Anomaly detection is not data quality. This class of defect is caught by a reconciliation check on row counts and key uniqueness, and never by a threshold on a metric.
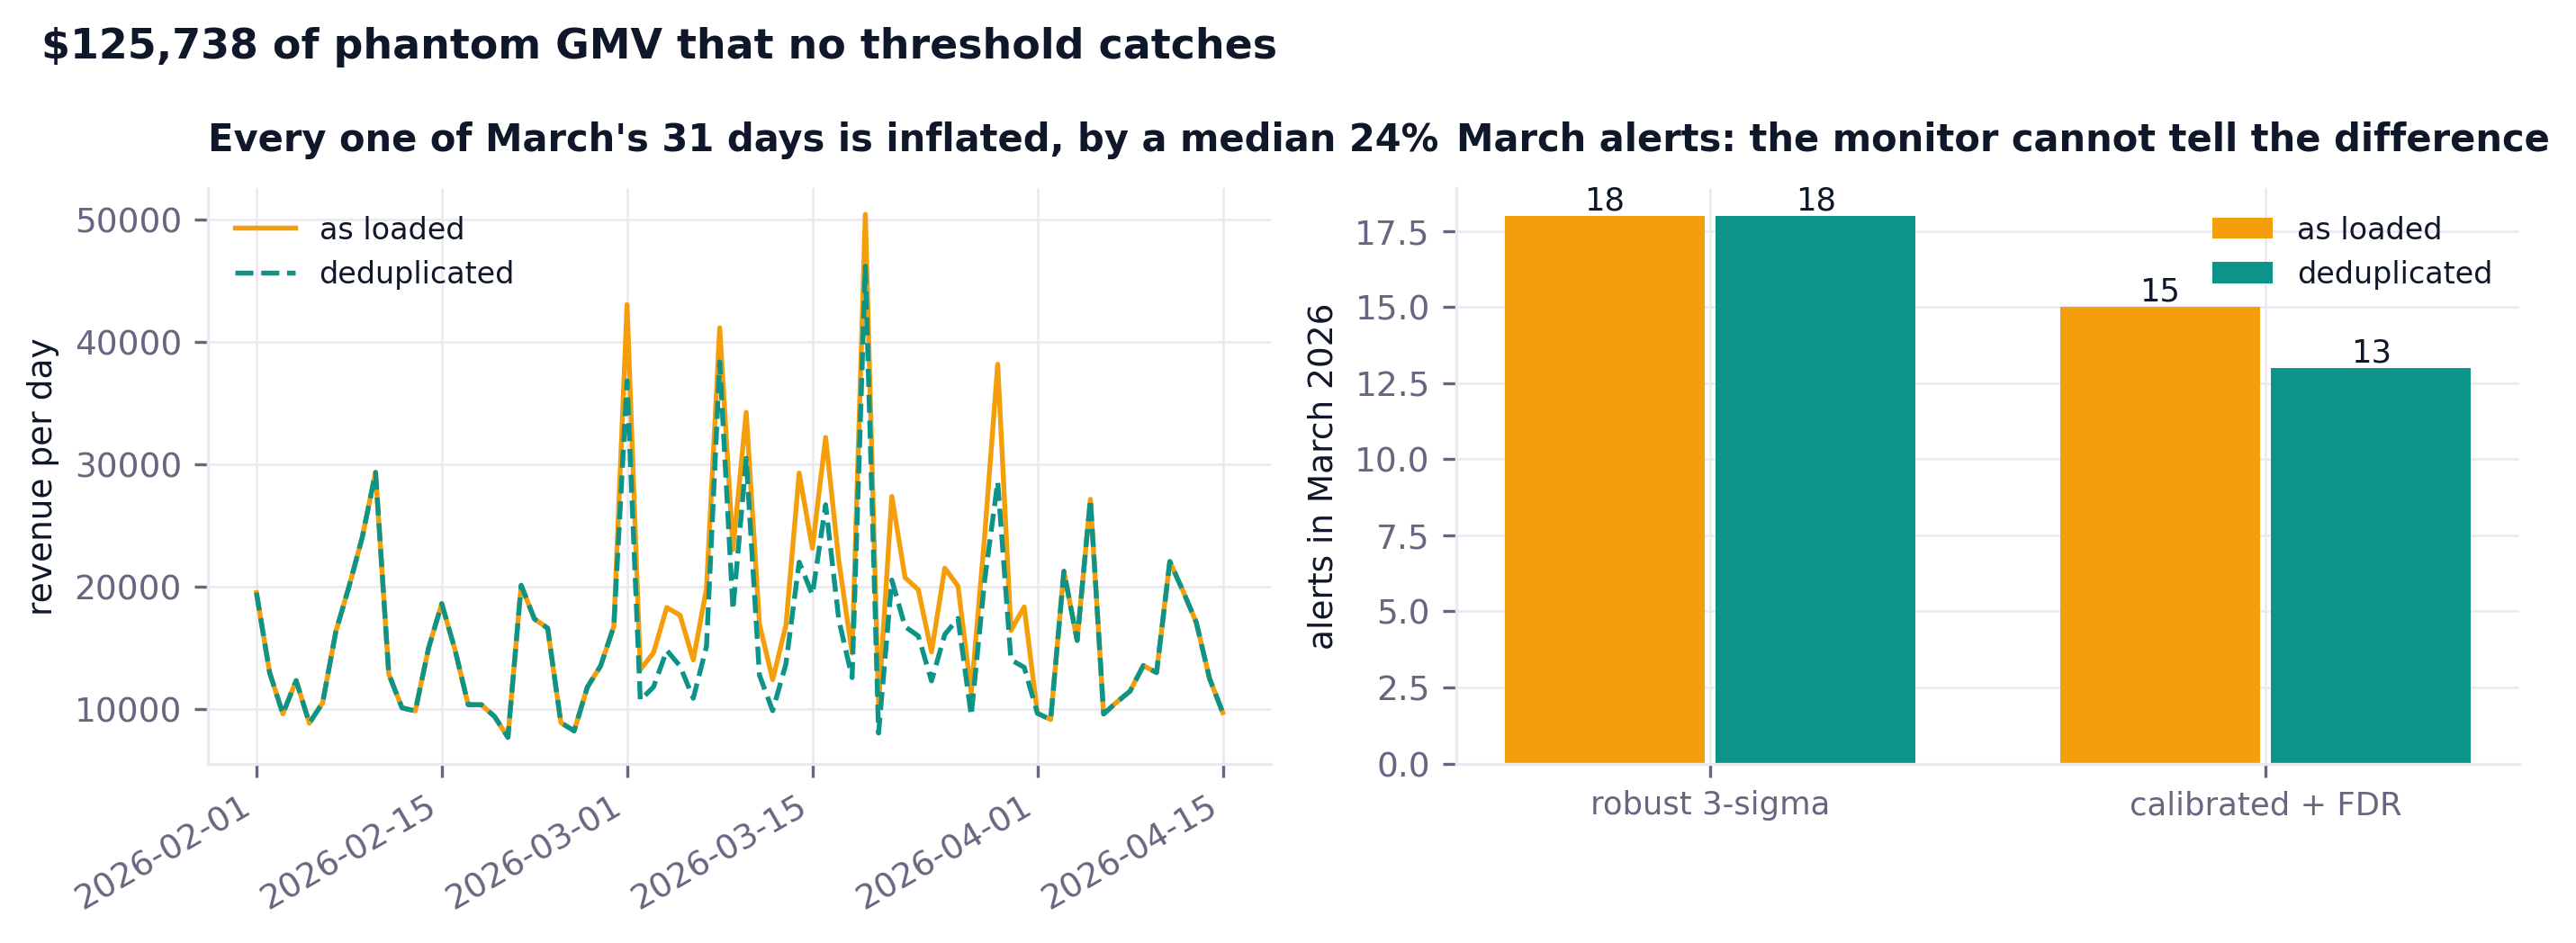
All money on this page is GMV. Everrest takes 11 percent, so the March overstatement is about $13,800 of platform revenue - a mart defect to reconcile, not a ledger entry.
Before any threshold is chosen, two things about the residual decide how the monitor will behave.
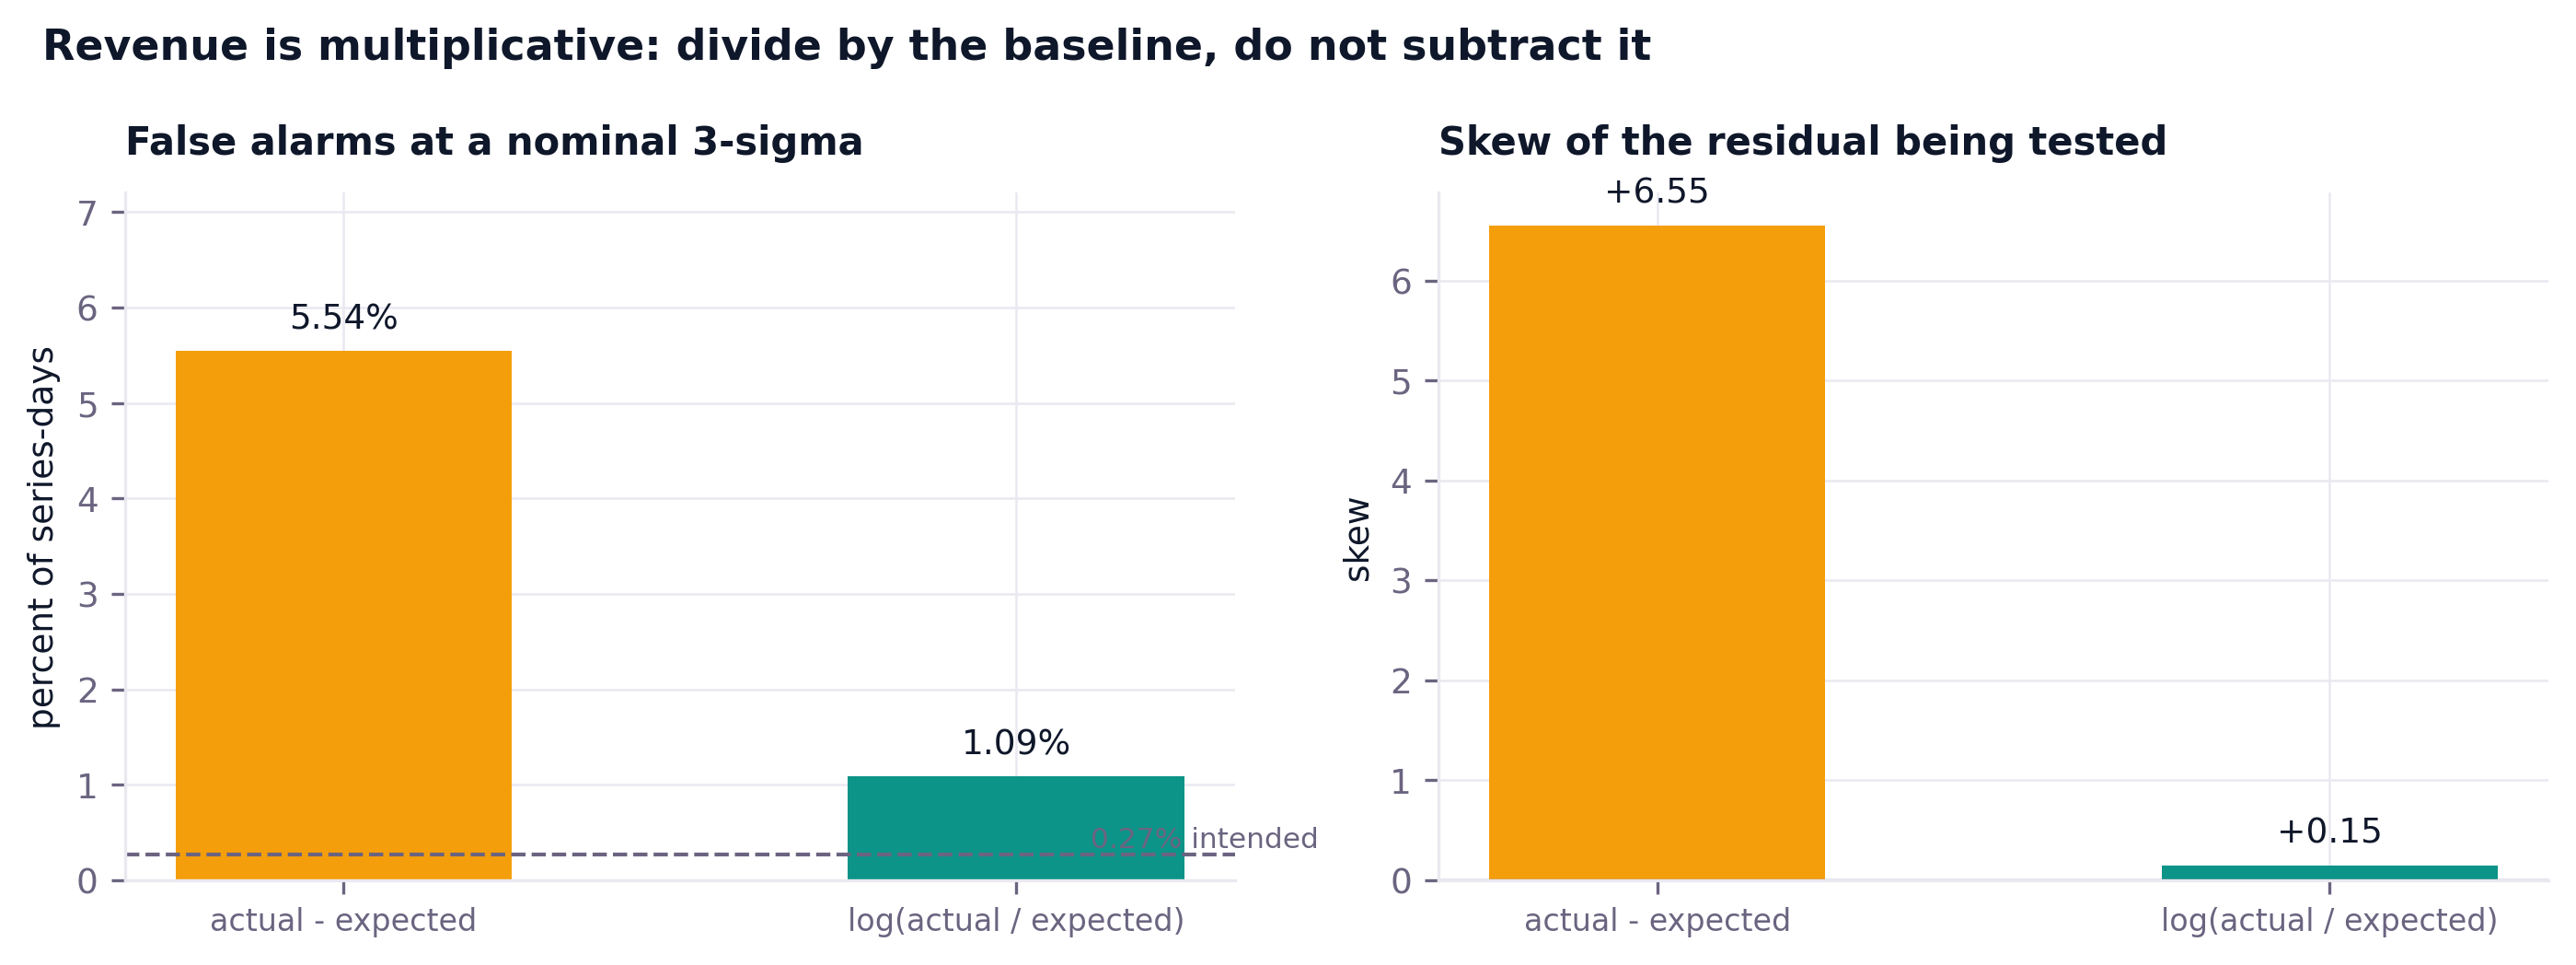
actual - expected is skewed +6.6 and trips a nominal 3-sigma threshold on 5.5% of series-days. log(actual / expected) is skewed +0.15 and trips it on 1.1% - 5.1x fewer false alarms, before any threshold is touched.
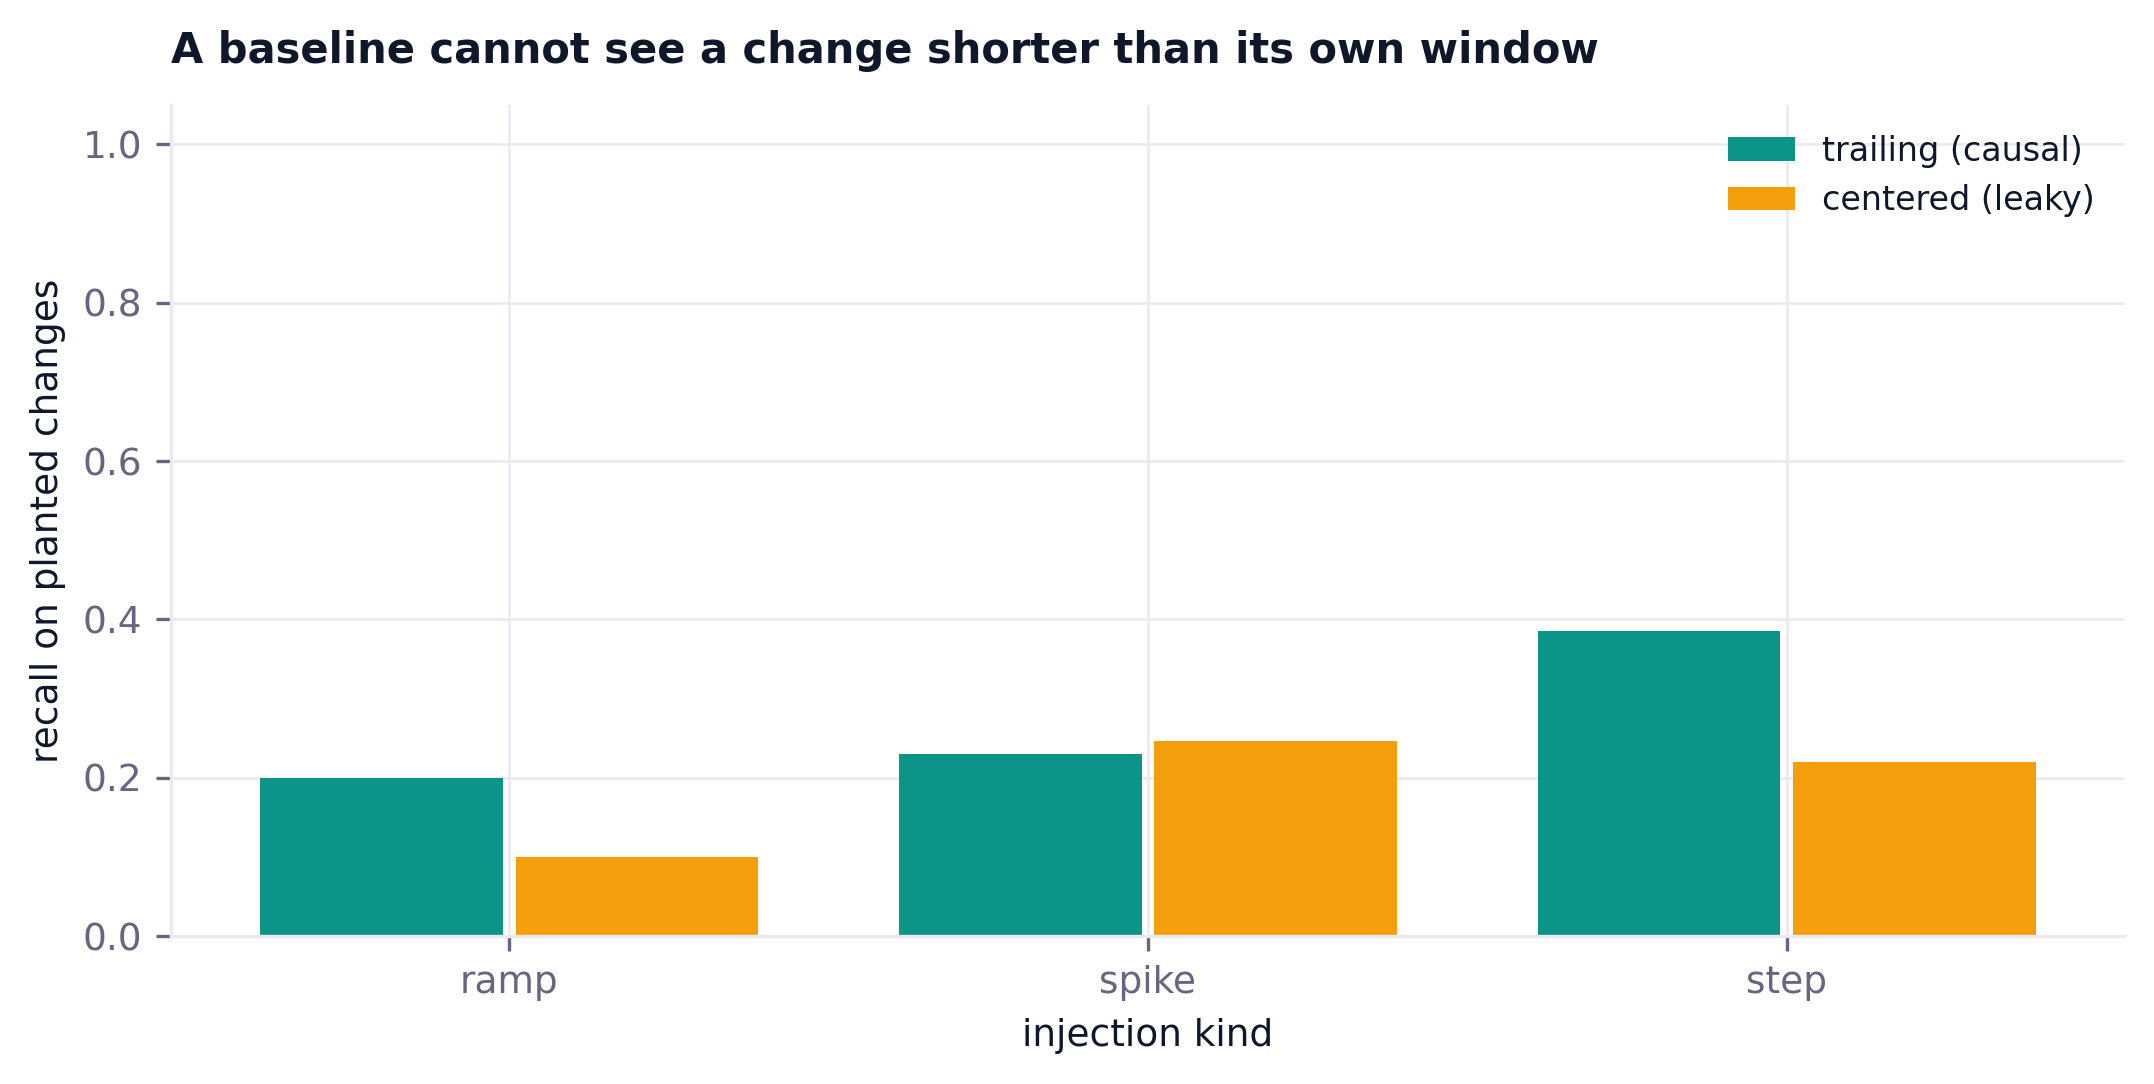
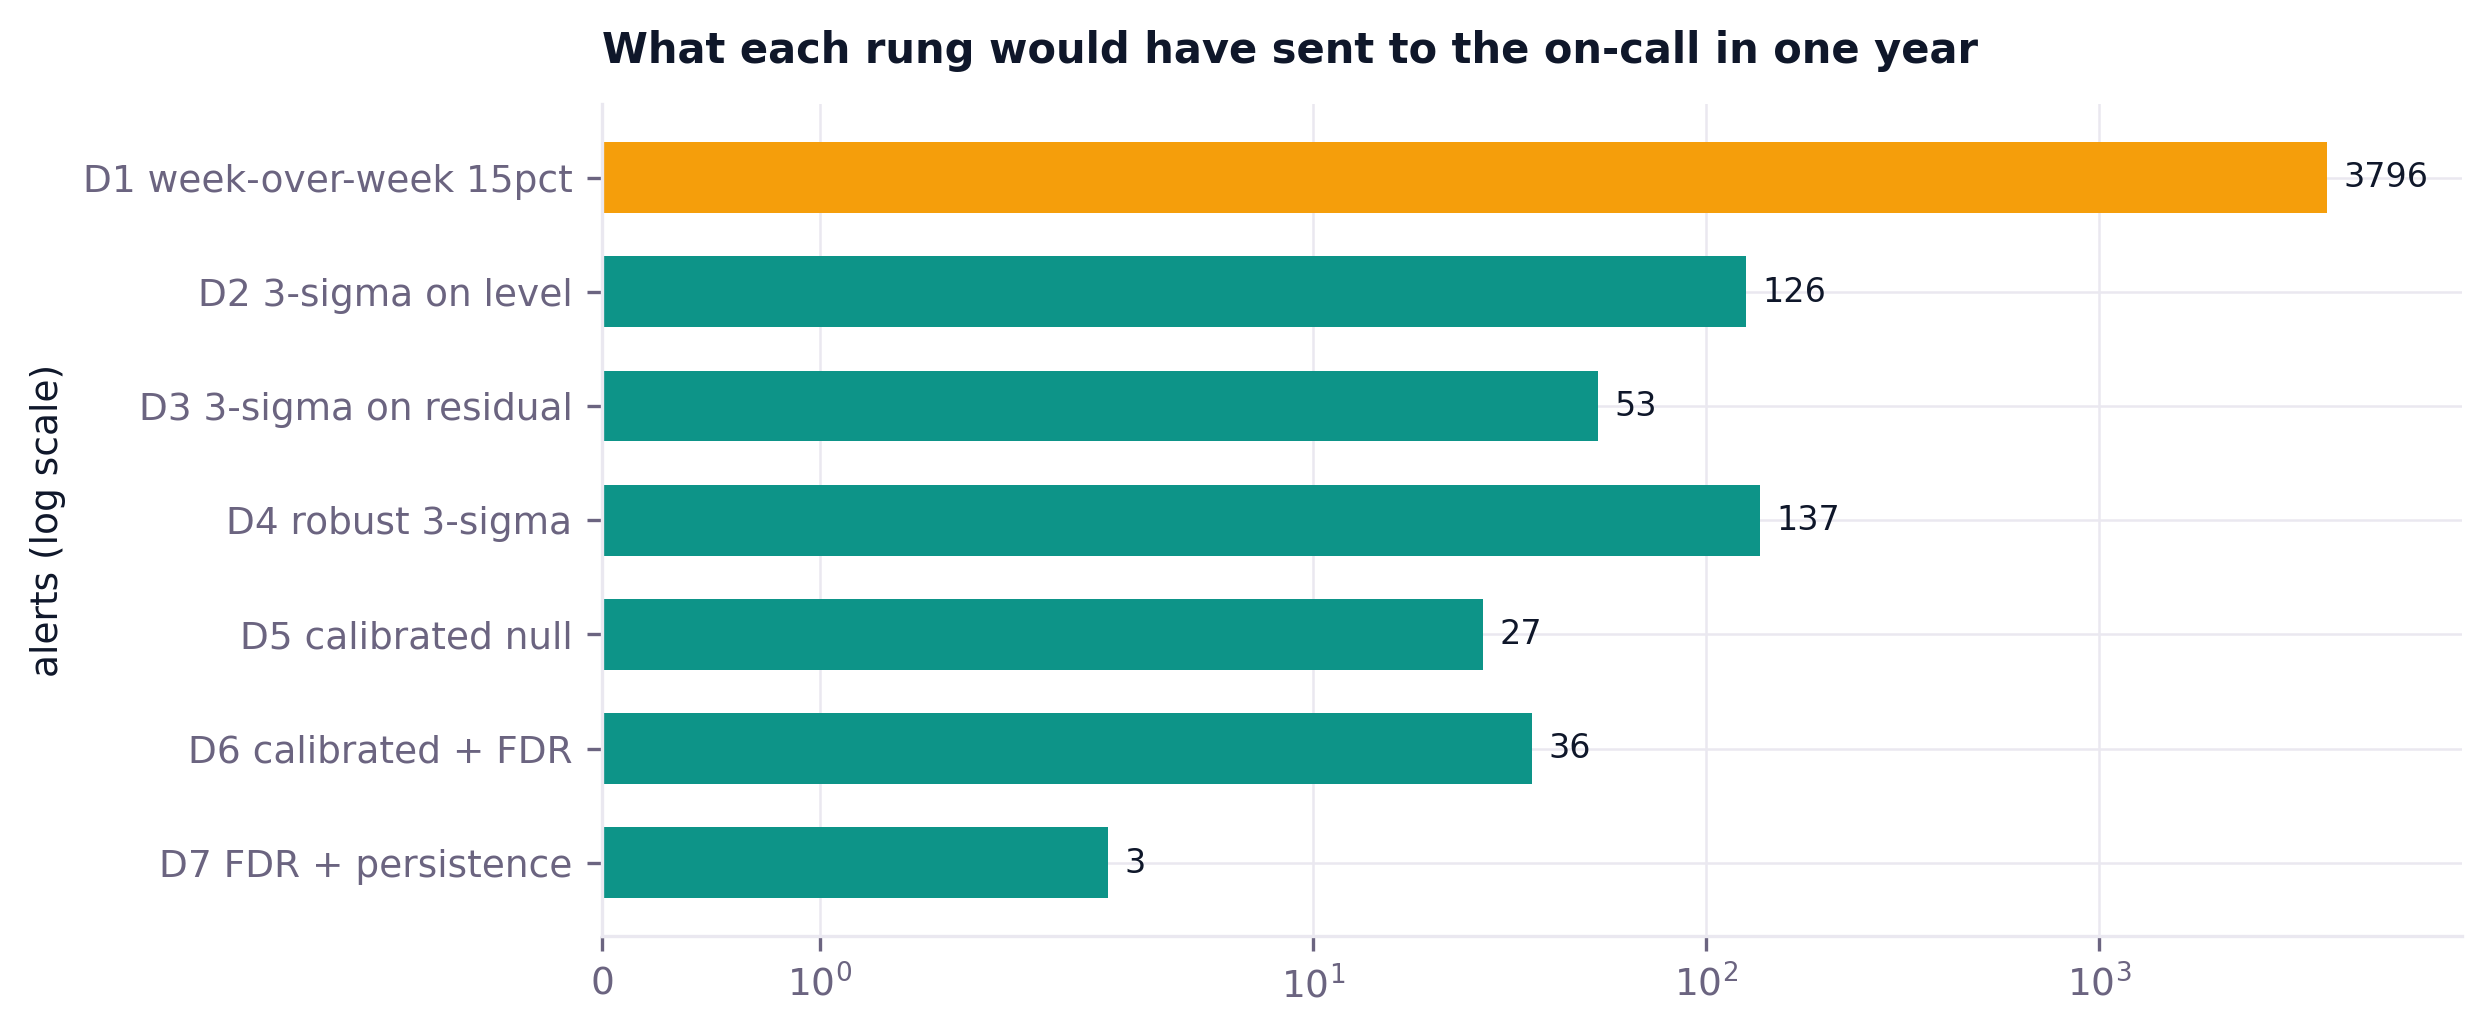
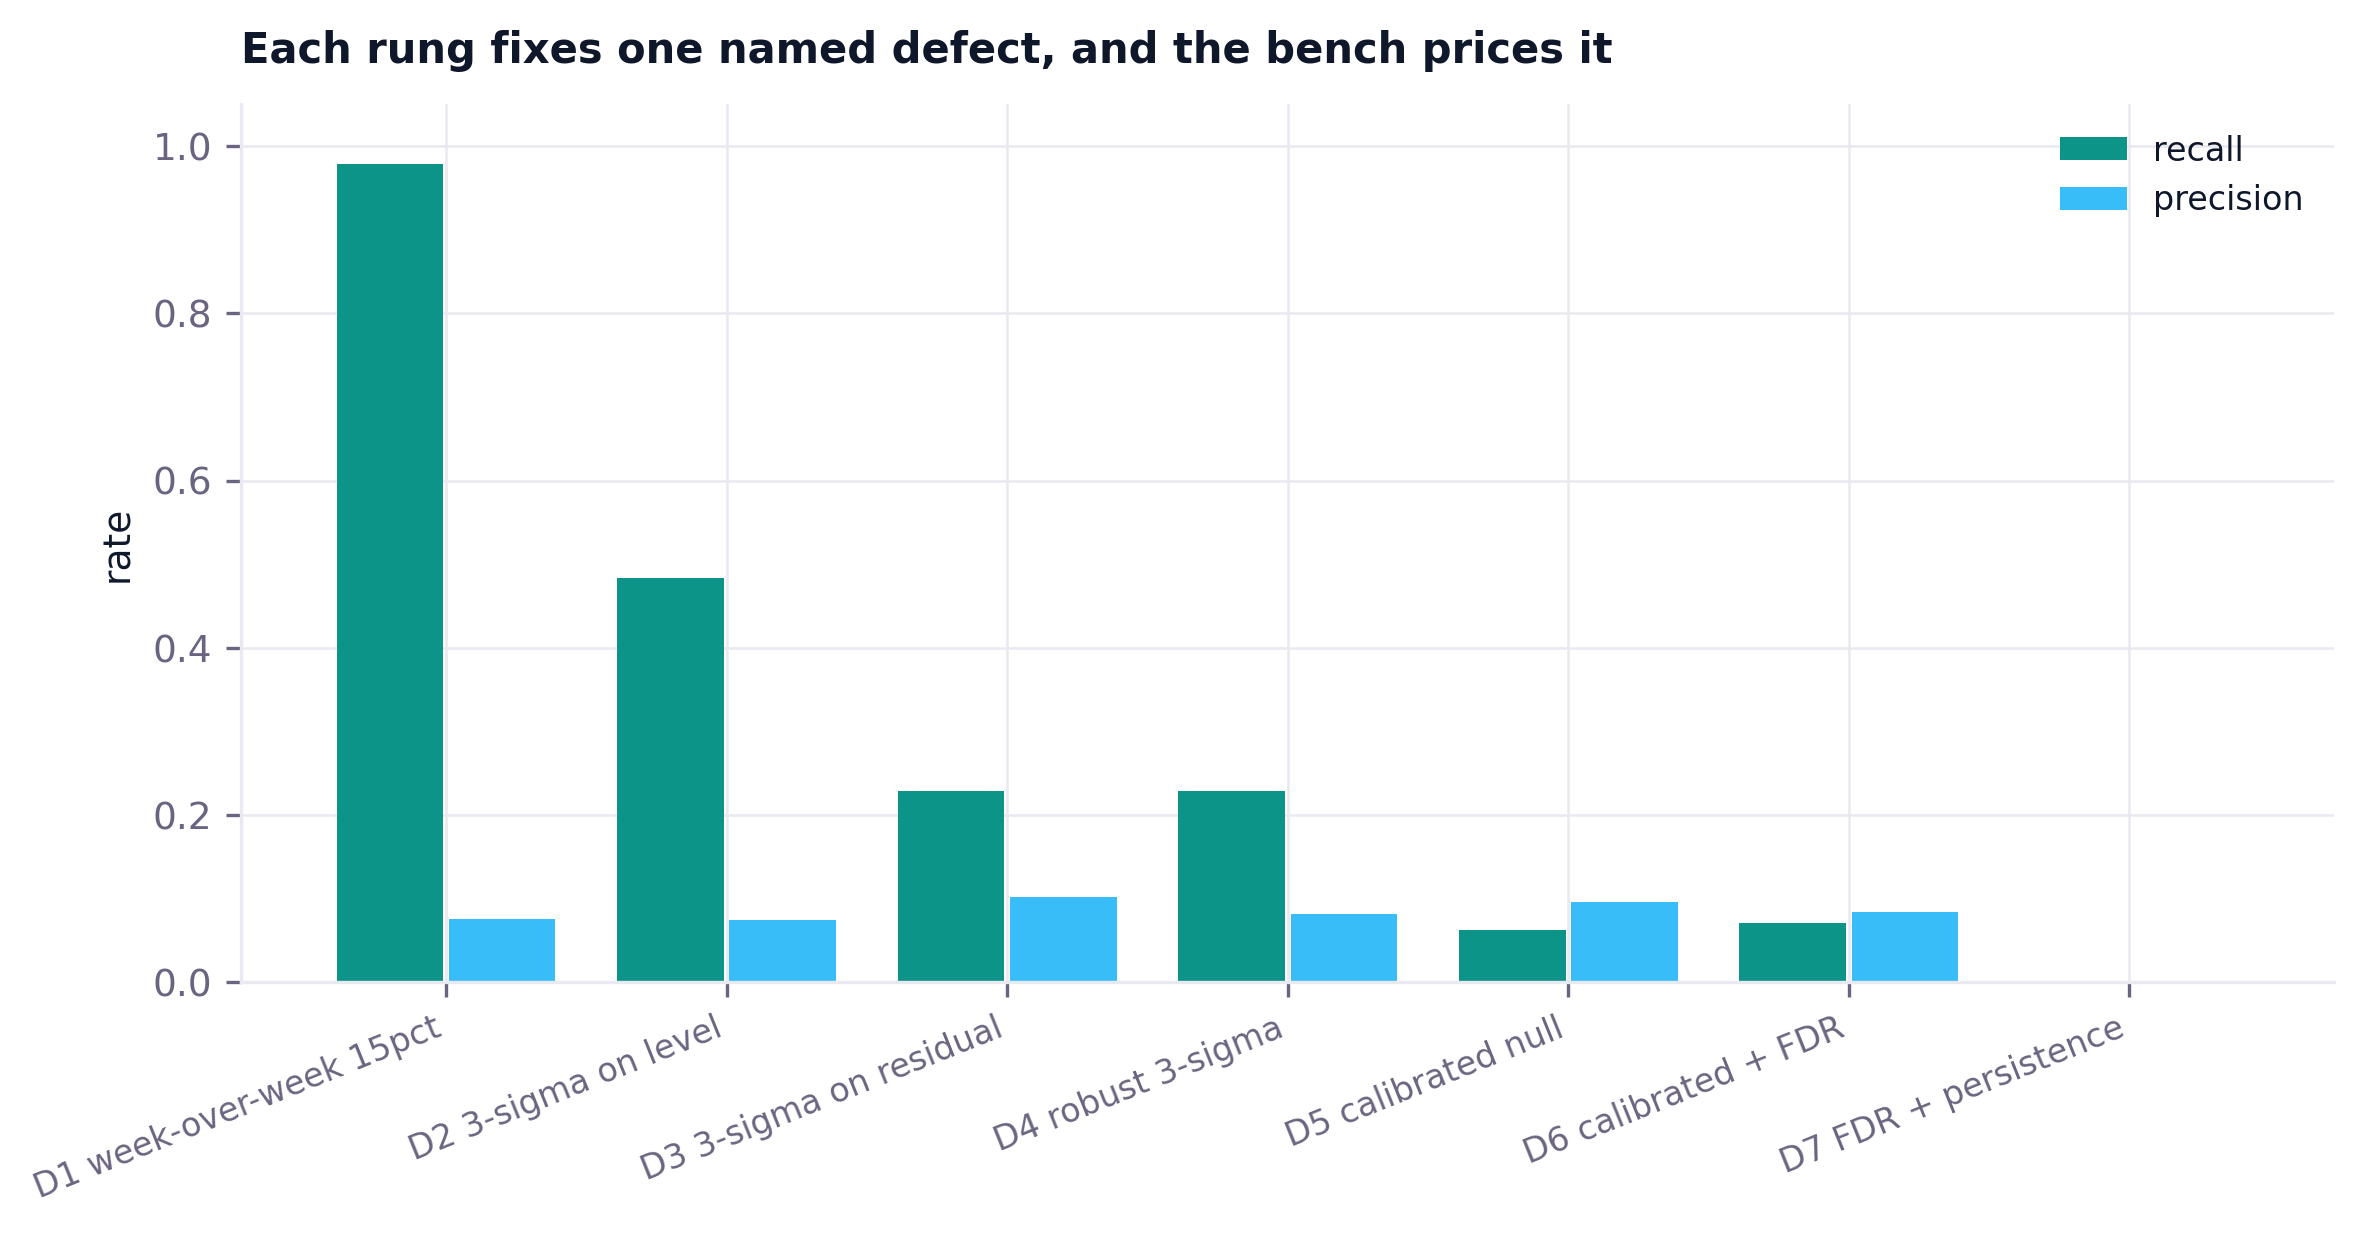
Seven rungs, each fixing one named defect in the one below. Scored against 240 planted changes across 20 replicates.
| rung | the defect it fixes | recall | precision | lift vs chance | lag (days) | false alarms/yr |
|---|---|---|---|---|---|---|
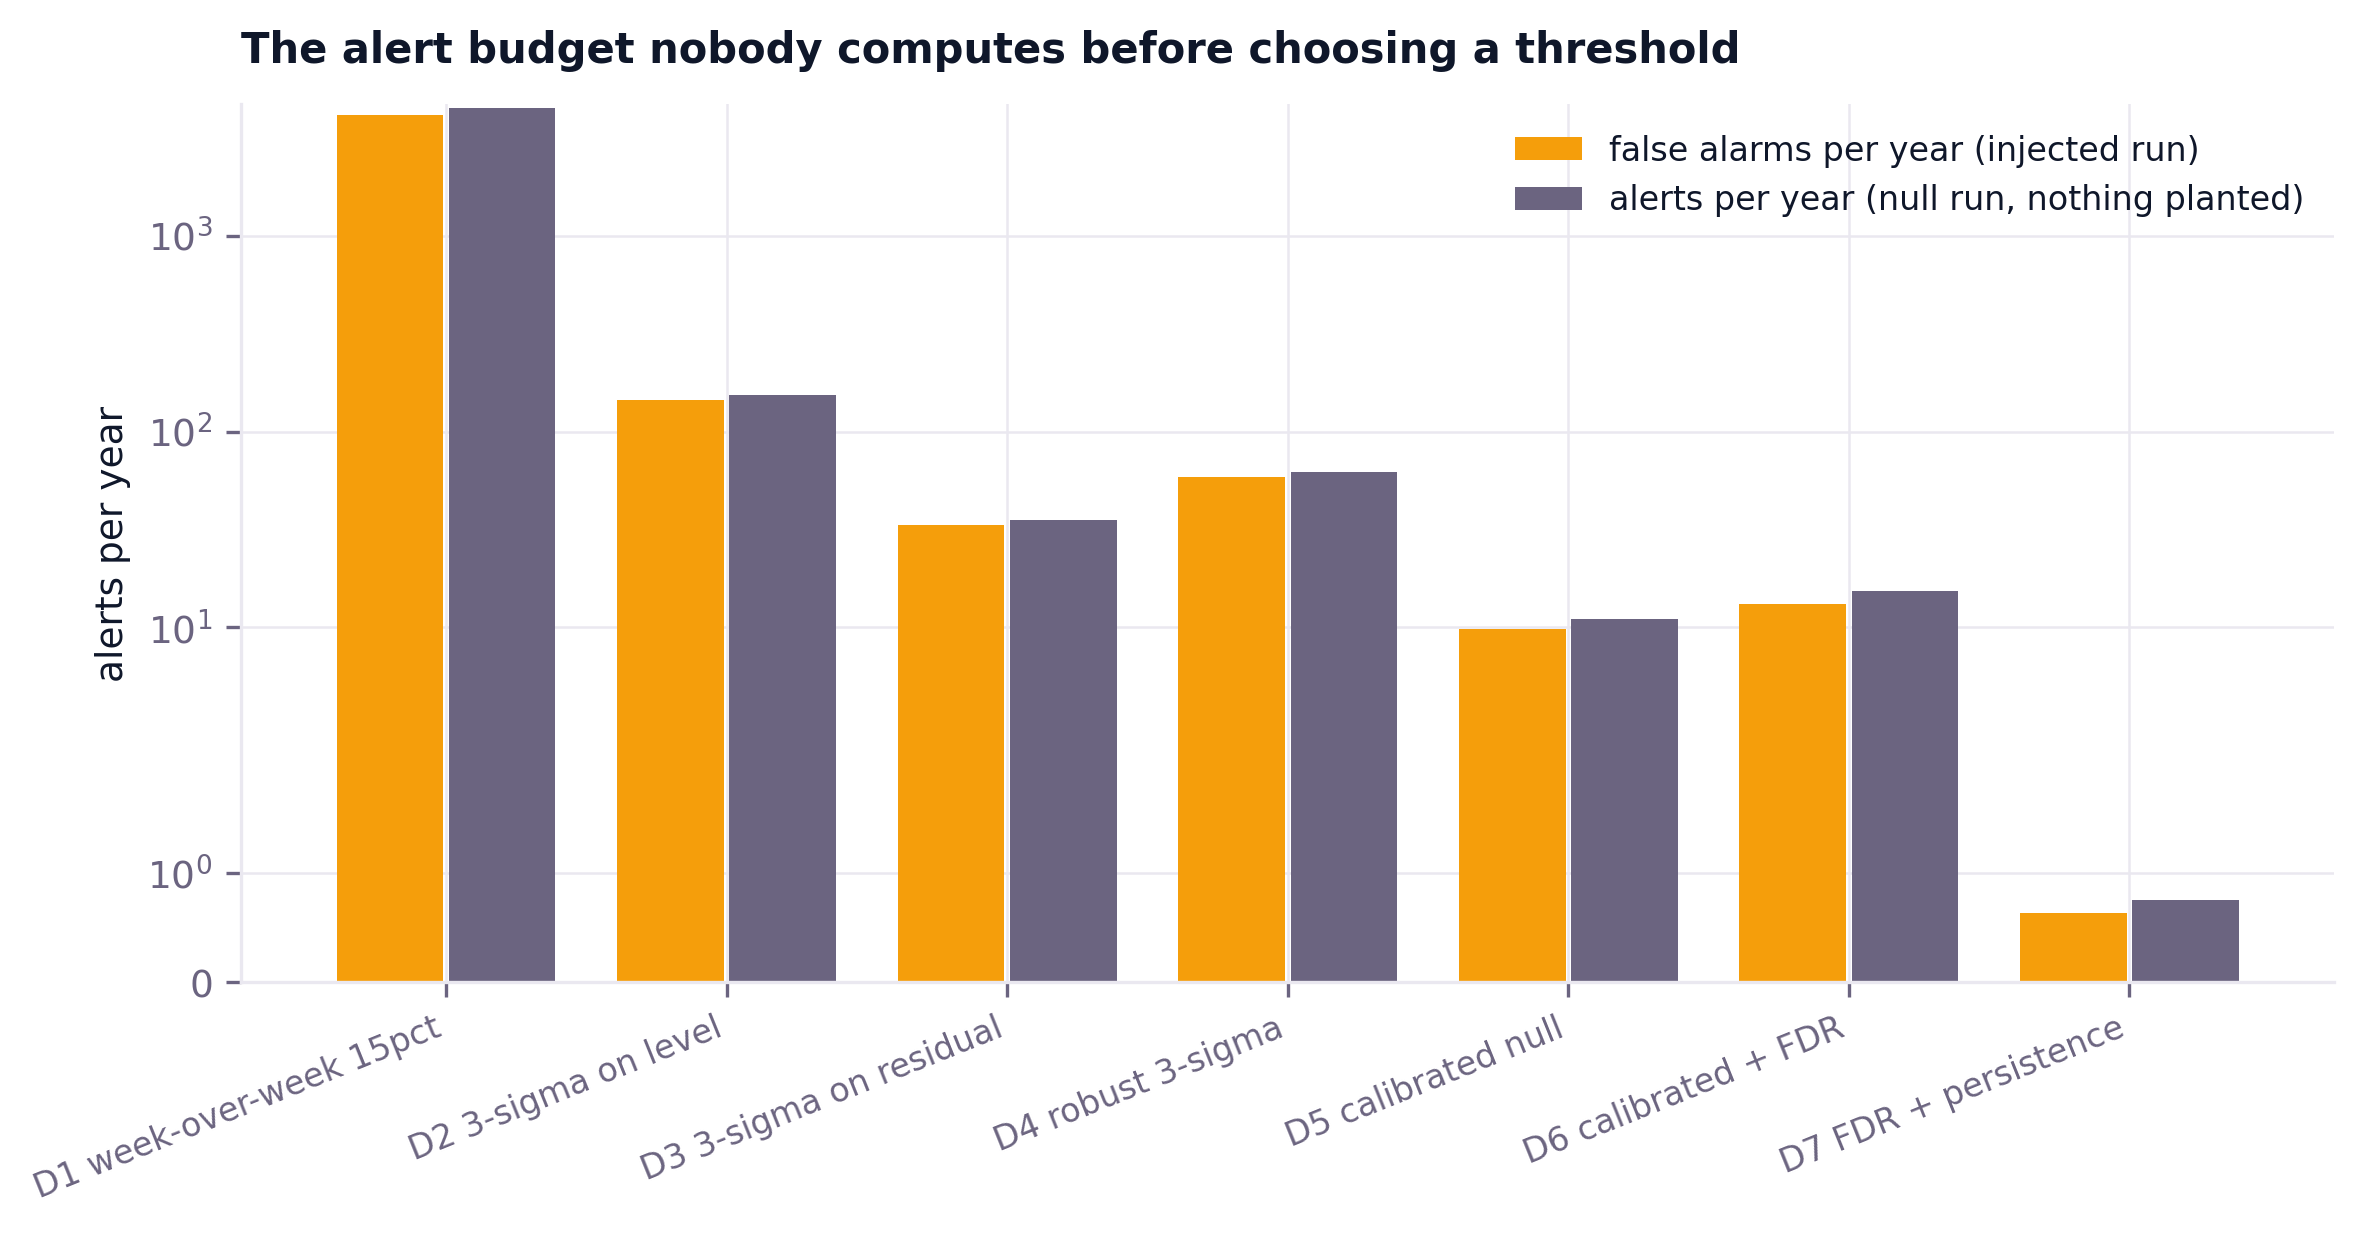
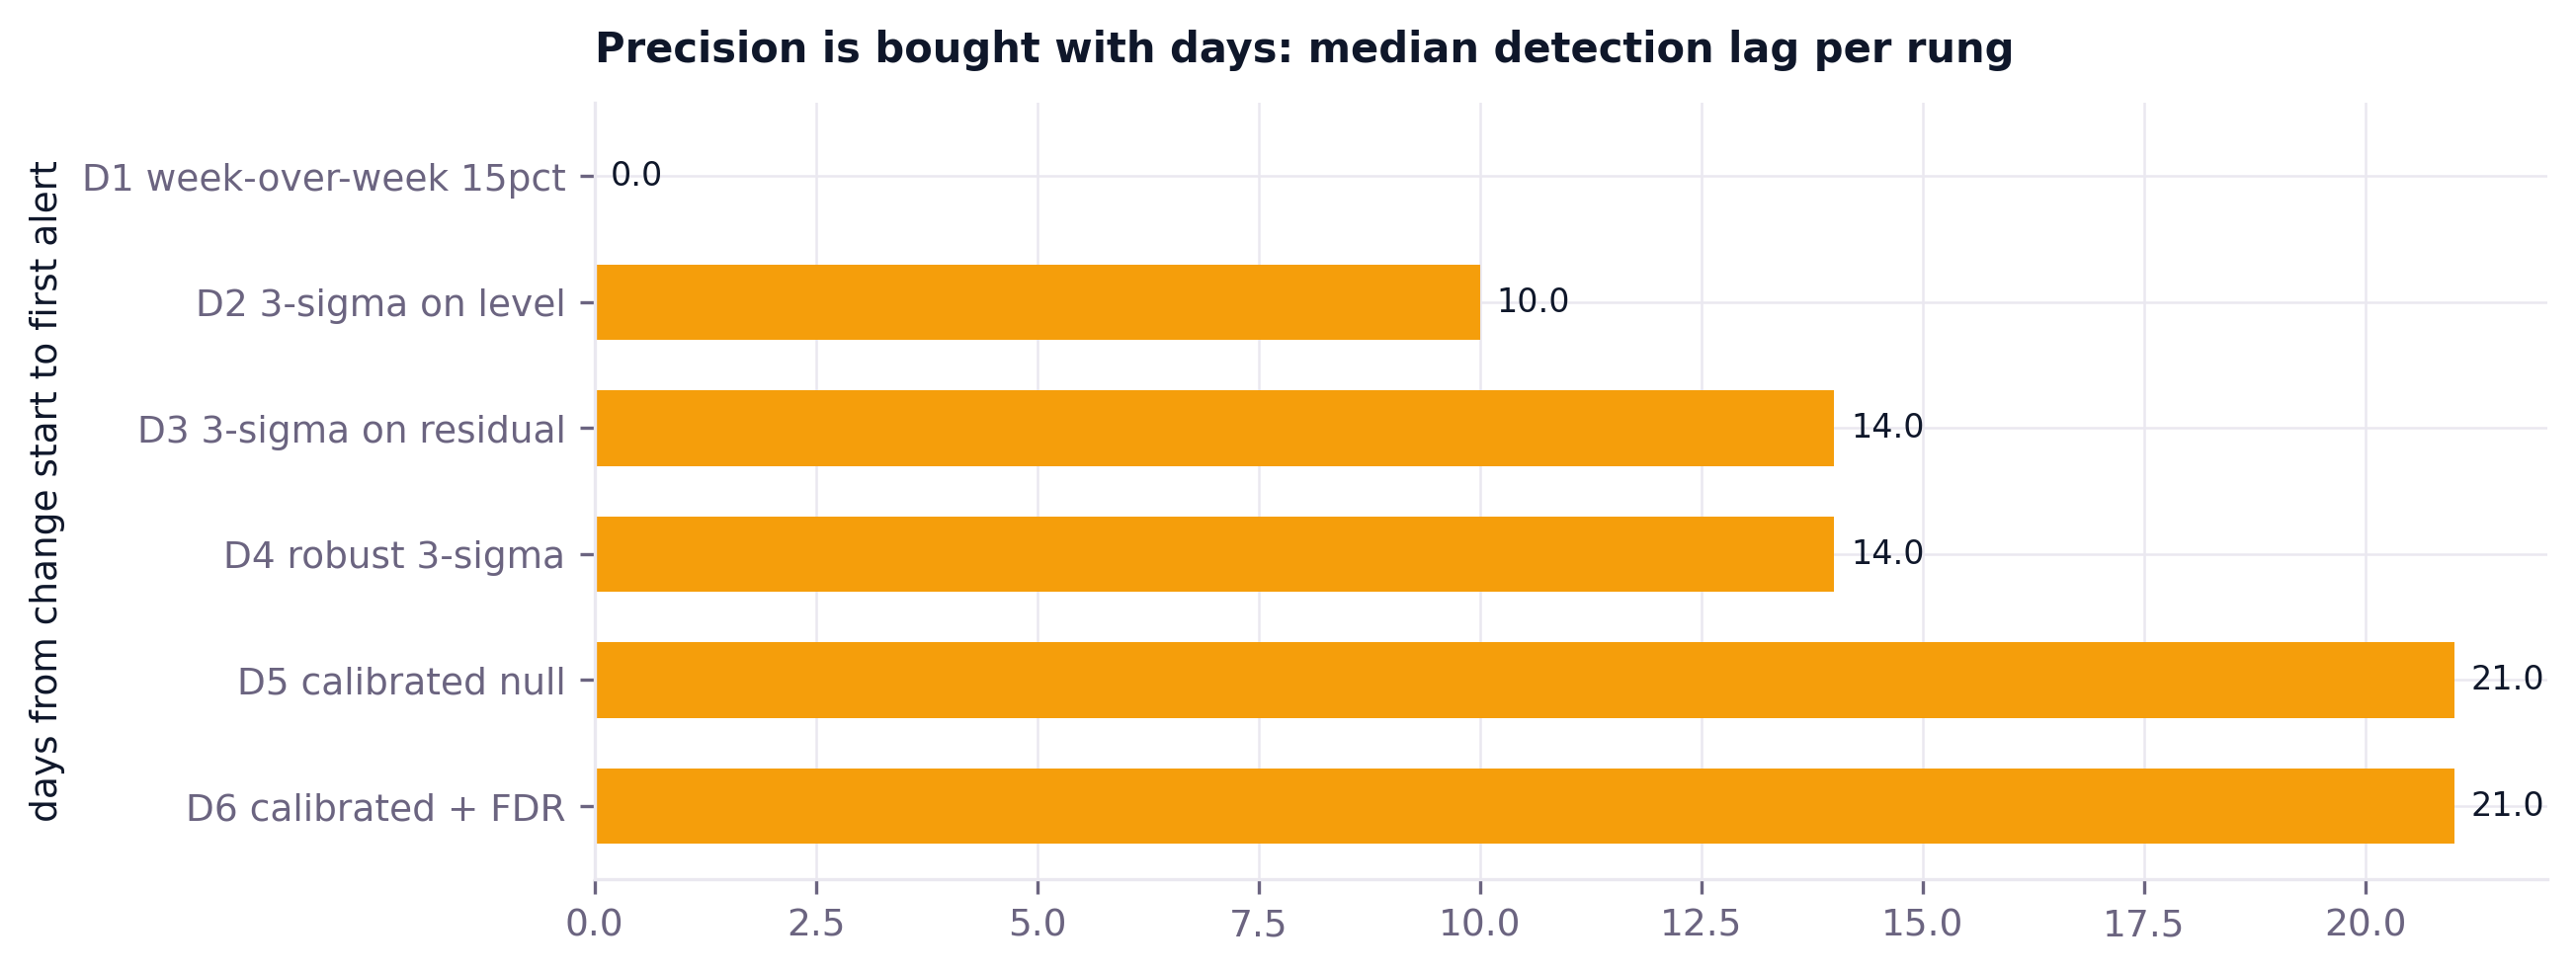
| D1 week-over-week 15% | what most teams ship | 98% | 7.5% | 0.99x | 0 | 4,121 |
| D2 3-sigma on level | no notion of variability | 48% | 7.4% | 0.98x | 10 | 145 |
| D3 3-sigma on residual | the level is seasonal | 23% | 10.2% | 1.35x | 14 | 33 |
| D4 robust 3-sigma | sd is dragged by the last incident | 23% | 8.2% | 1.08x | 14 | 58 |
| D5 calibrated null | 3-sigma is not a 0.27% rule | 6% | 9.6% | 1.27x | 21 | 10 |
| D6 calibrated + FDR | many series, many chances | 7% | 8.4% | 1.11x | 21 | 13 |
| D7 FDR + persistence | a one-day wobble is not an incident | 0% | - | - | - | 1 |
D7 is dead on this board - under two alerts a year, detecting nothing. It is reported rather than dropped, because a rung that is silent is an outcome and hiding it would flatter the ladder.
7.6 percent of live series-days sit inside a planted change, so a detector alerting at random scores 7.6 percent precision. Measured precision across the ladder runs 7.4 to 10.2 percent. The best lift over chance is 1.35x and two rungs score below chance. Precision in the single digits reads as weak but real until you put the base rate next to it - at which point no rung here has demonstrated meaningful discriminative power. That is the finding, not a caveat.
The table above compares seven rules at seven arbitrary thresholds, and recall moves with the threshold. Retuning every rung to the same false-alarm budget is the only comparison that isolates the idea from its operating point - and it changes the answer.
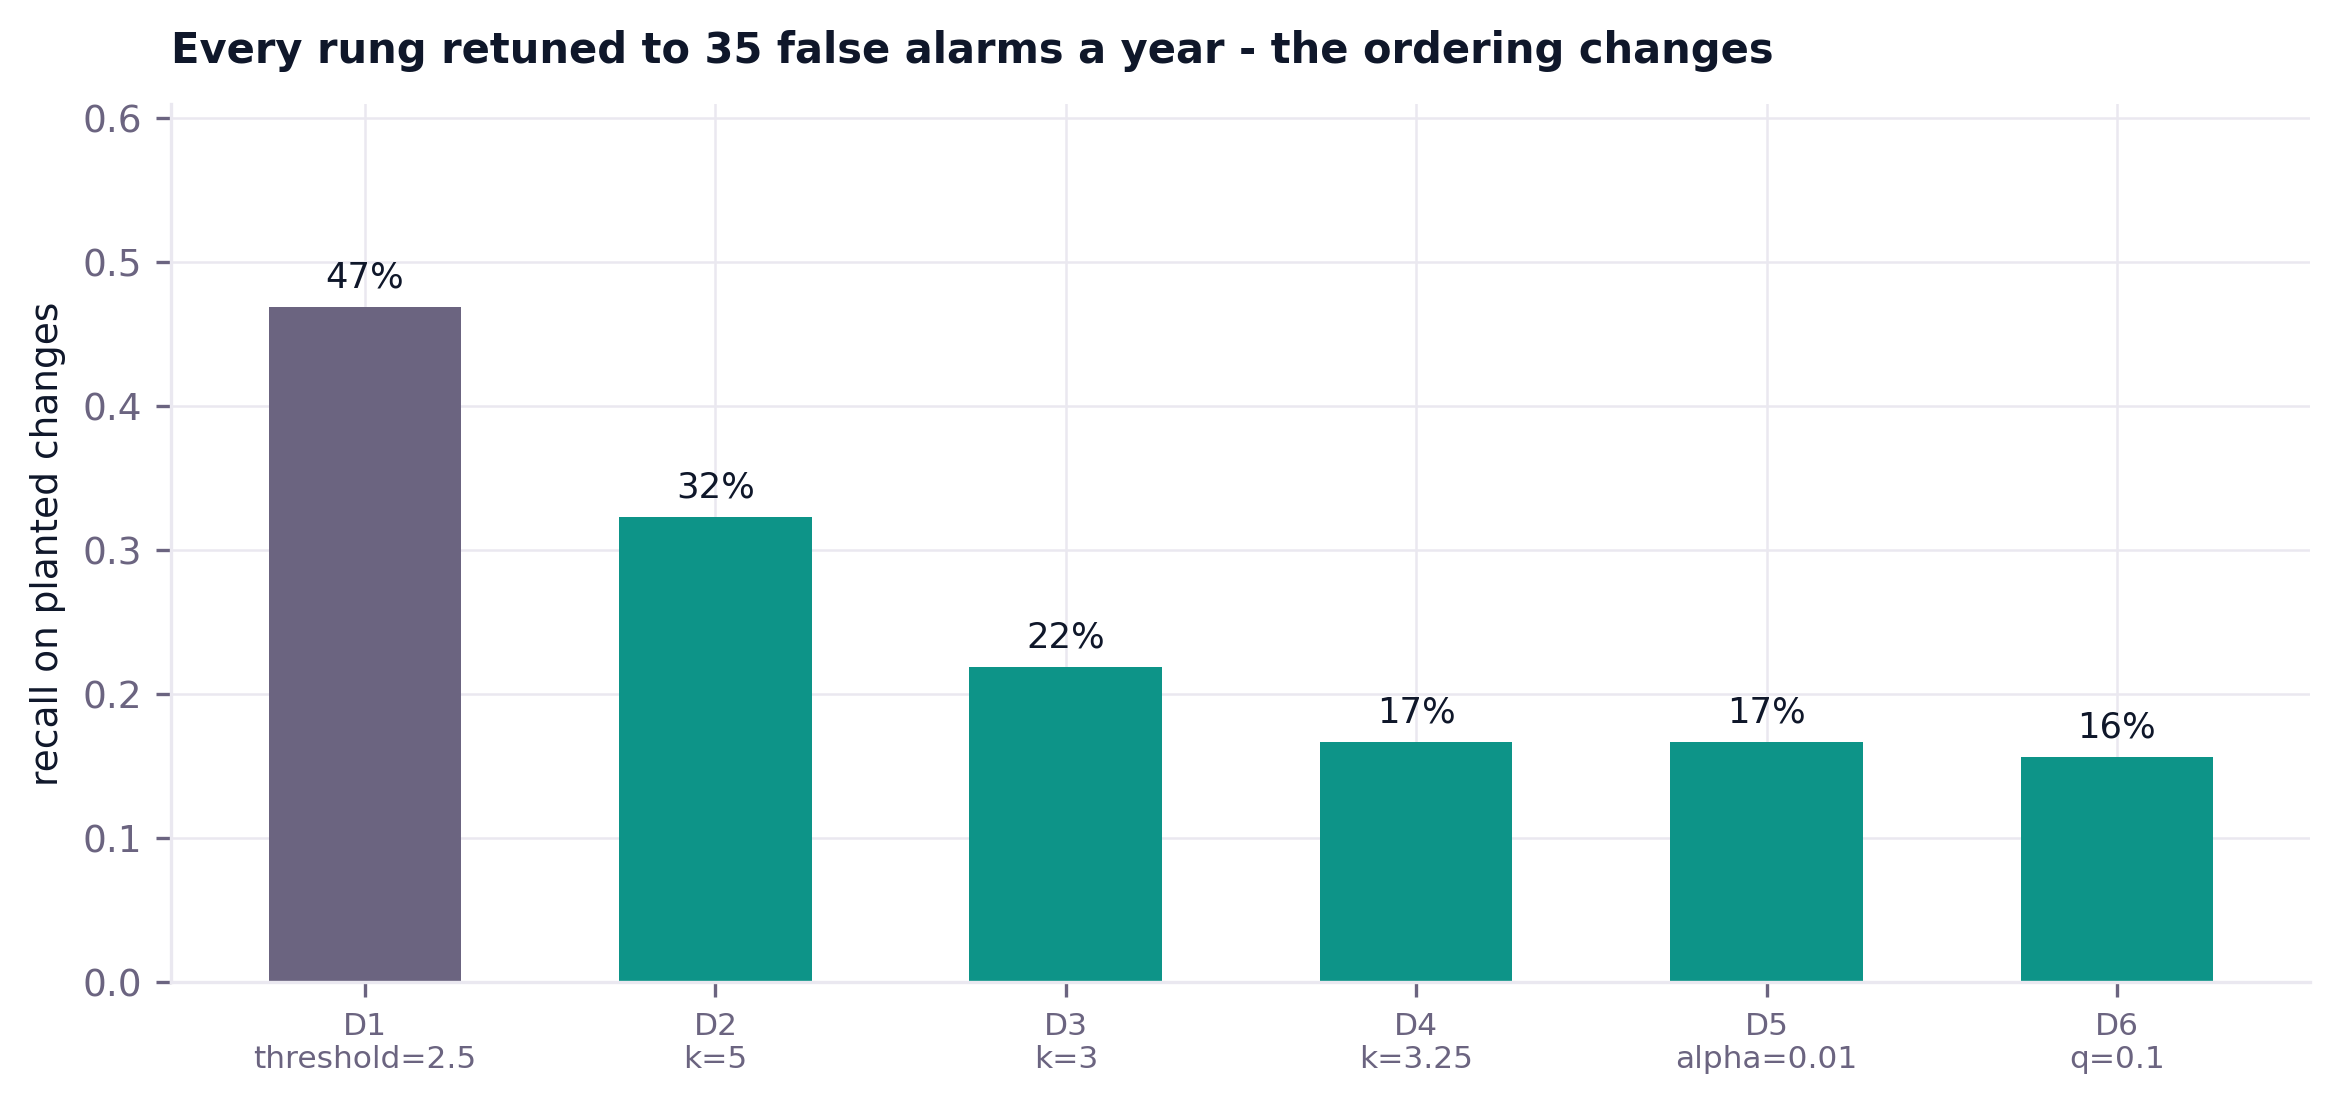
D2 on the raw level reaches 32 percent recall at k=5, D3 reaches 22 percent, and the calibrated rungs land at 17 and 16. The week-over-week rule cannot be tuned onto the budget at all within a sane range - at a 250 percent threshold it still fires 145 times a year, which is itself the finding: a rule with no usable operating point is not a strict rule, it is the wrong rule. Comparing detectors at their default thresholds measures the thresholds.
Before tuning anything, compute how large your real incident is in units of one bucket's noise.
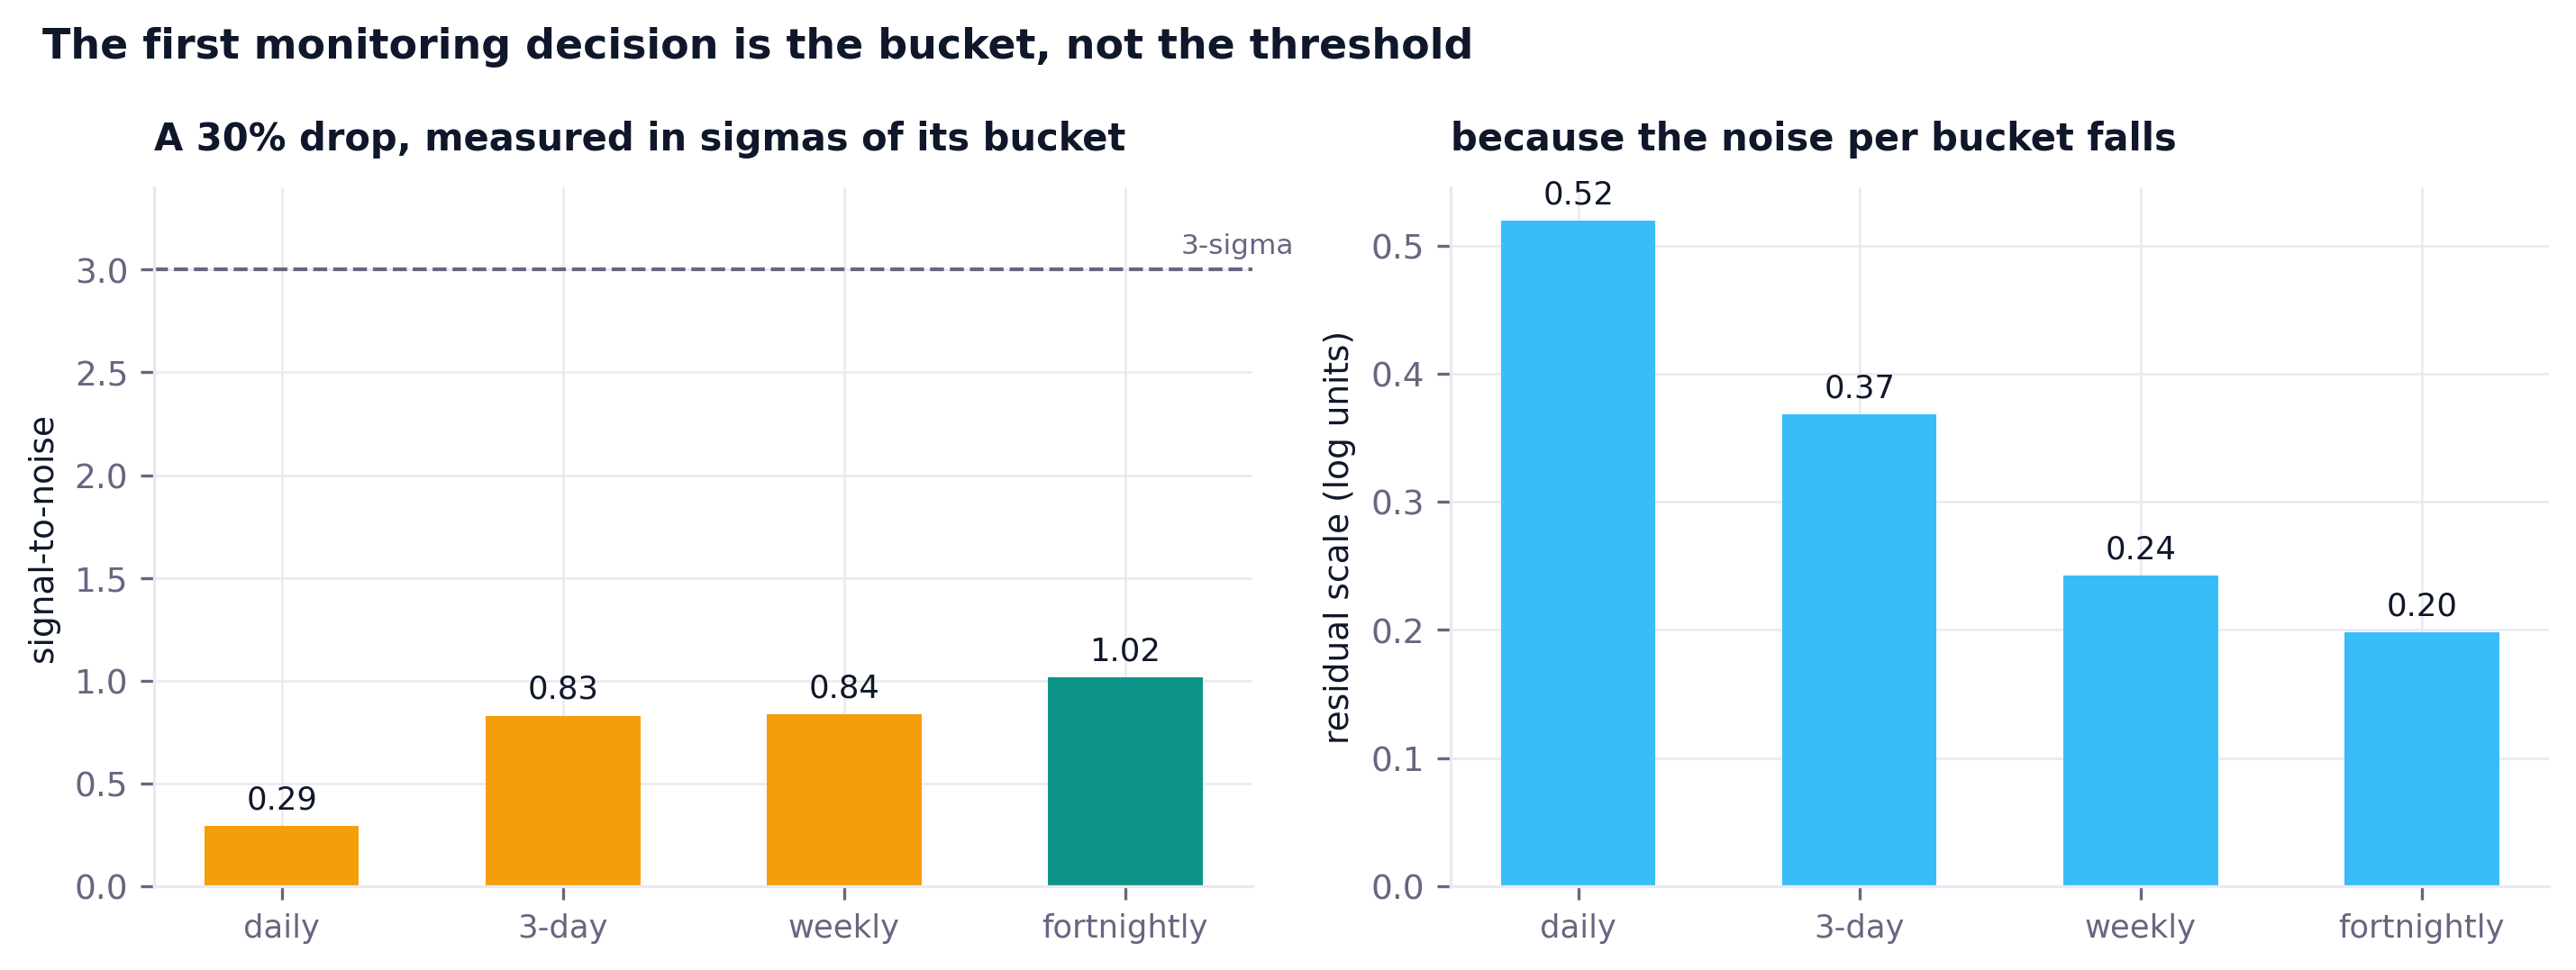
A genuine commercial emergency is worth less than a third of one day's noise on this board. No threshold separates that from an ordinary Tuesday, and lowering the threshold buys every Tuesday instead. At a fortnightly bucket the same drop is 1.02 sigma. Two real mechanisms contribute: the noise per bucket falls from 0.52 to 0.20 log units, and the trailing window stops eating the signal - 57 percent of a 45-day step has already been learned away at daily cadence. A monitor that stops alerting is not evidence the incident ended. The first monitoring decision is the bucket, not the threshold, and it is usually made by accident, by inheriting a daily dashboard.
End-to-end recall by cadence is deliberately not reported. One year of Everrest yields 26 fortnightly buckets against a 44-bucket warmup, so a fortnightly monitor on this history never becomes live at all - any recall comparison would measure how much history each cadence had. The signal-to-noise above is a property of the data and survives that objection; a recall number would not.
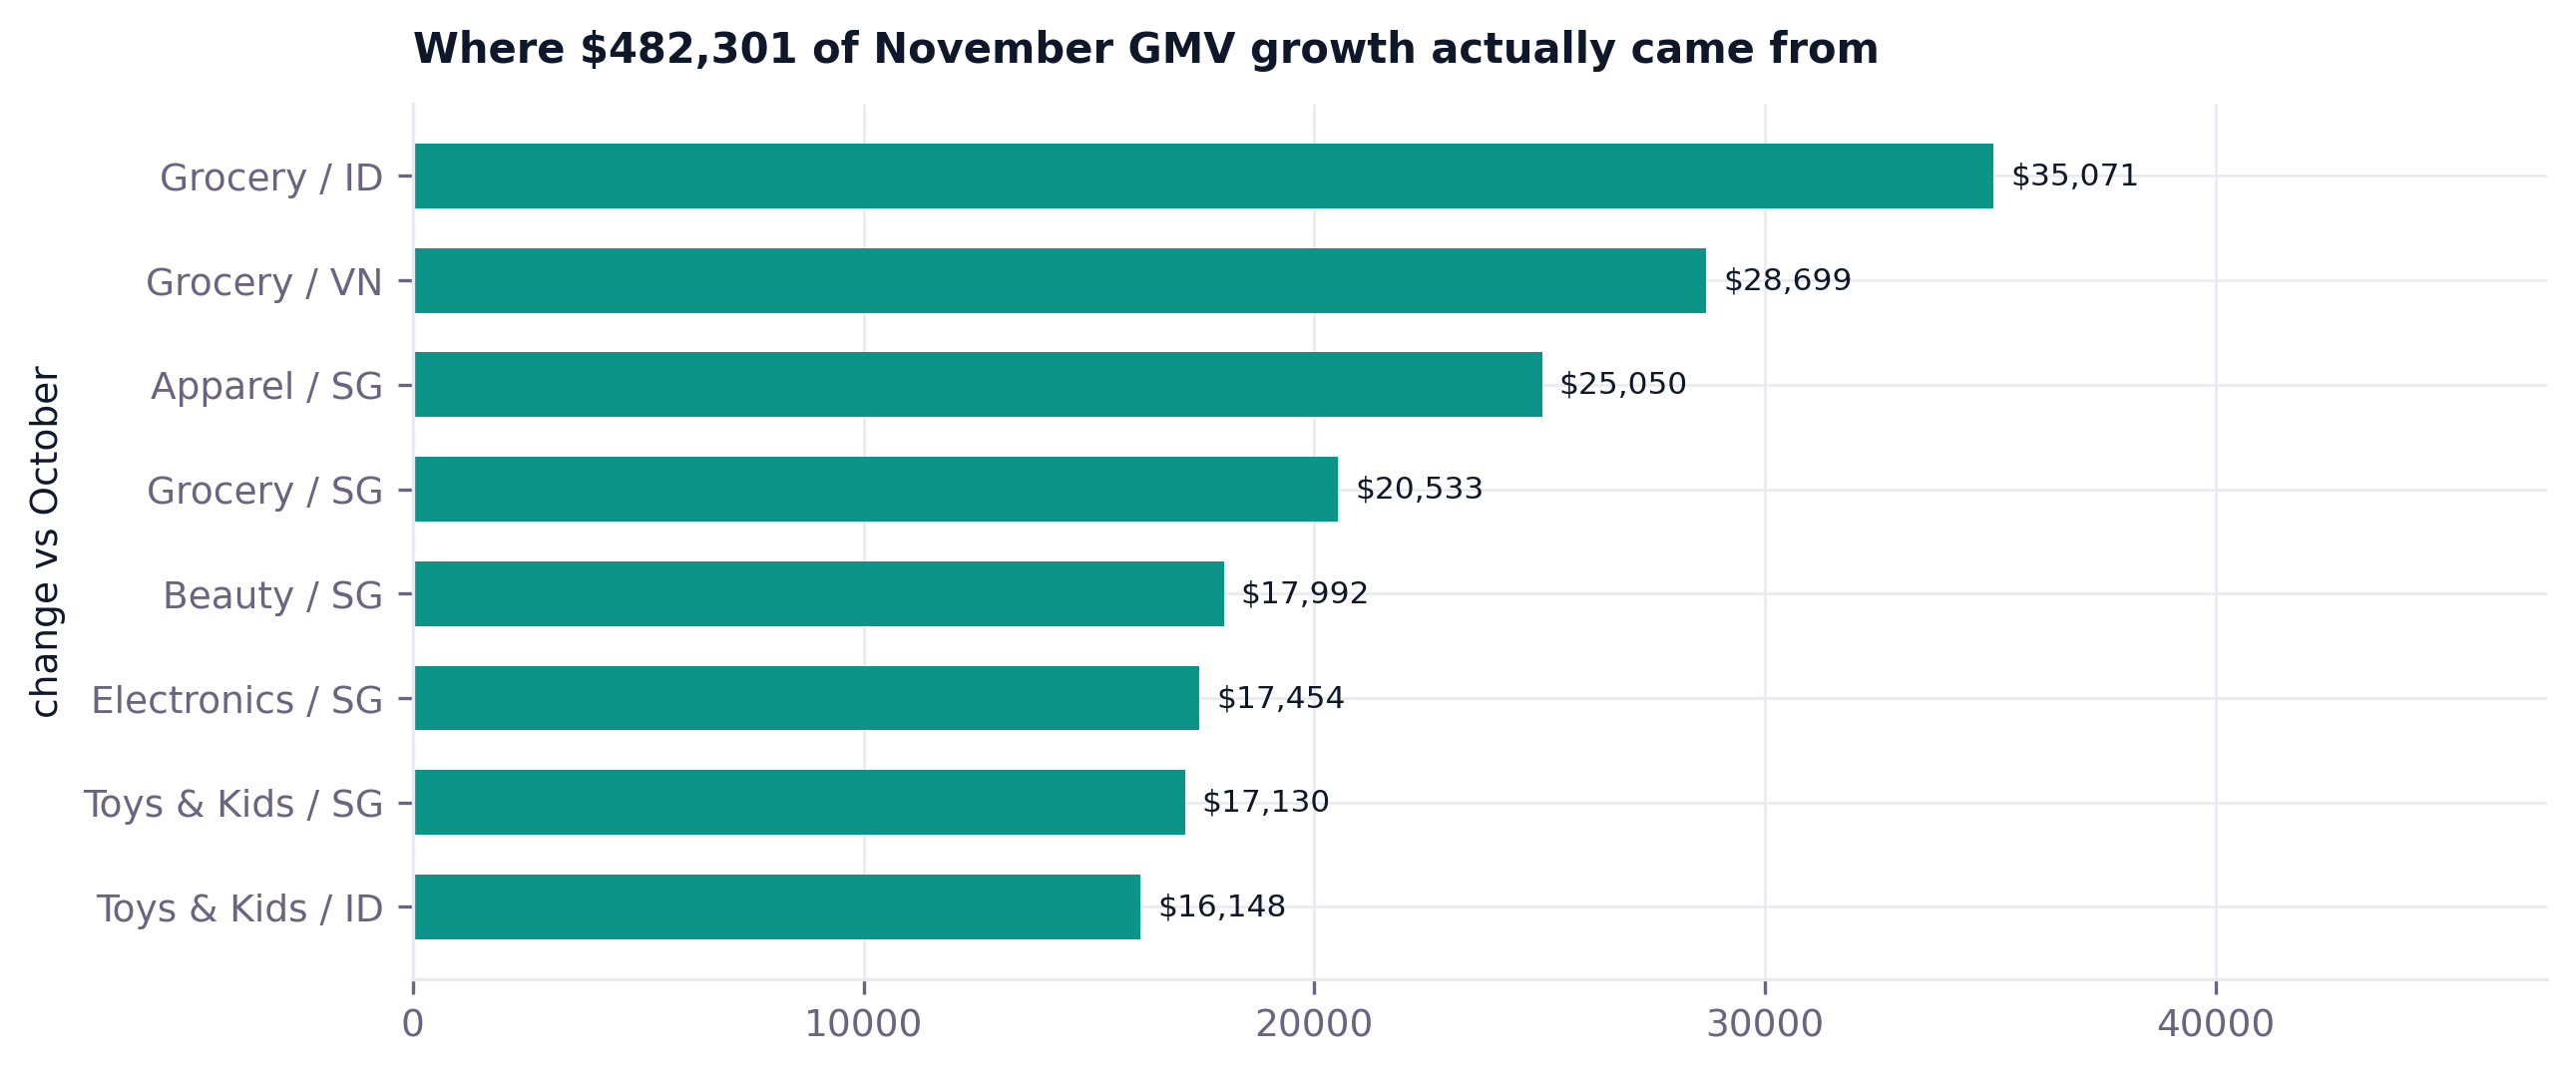
Detection needs a distributional assumption and so has to respect sparsity. Decomposition is exact arithmetic on sums and does not, so attribution runs at the fine grain the monitor refuses.
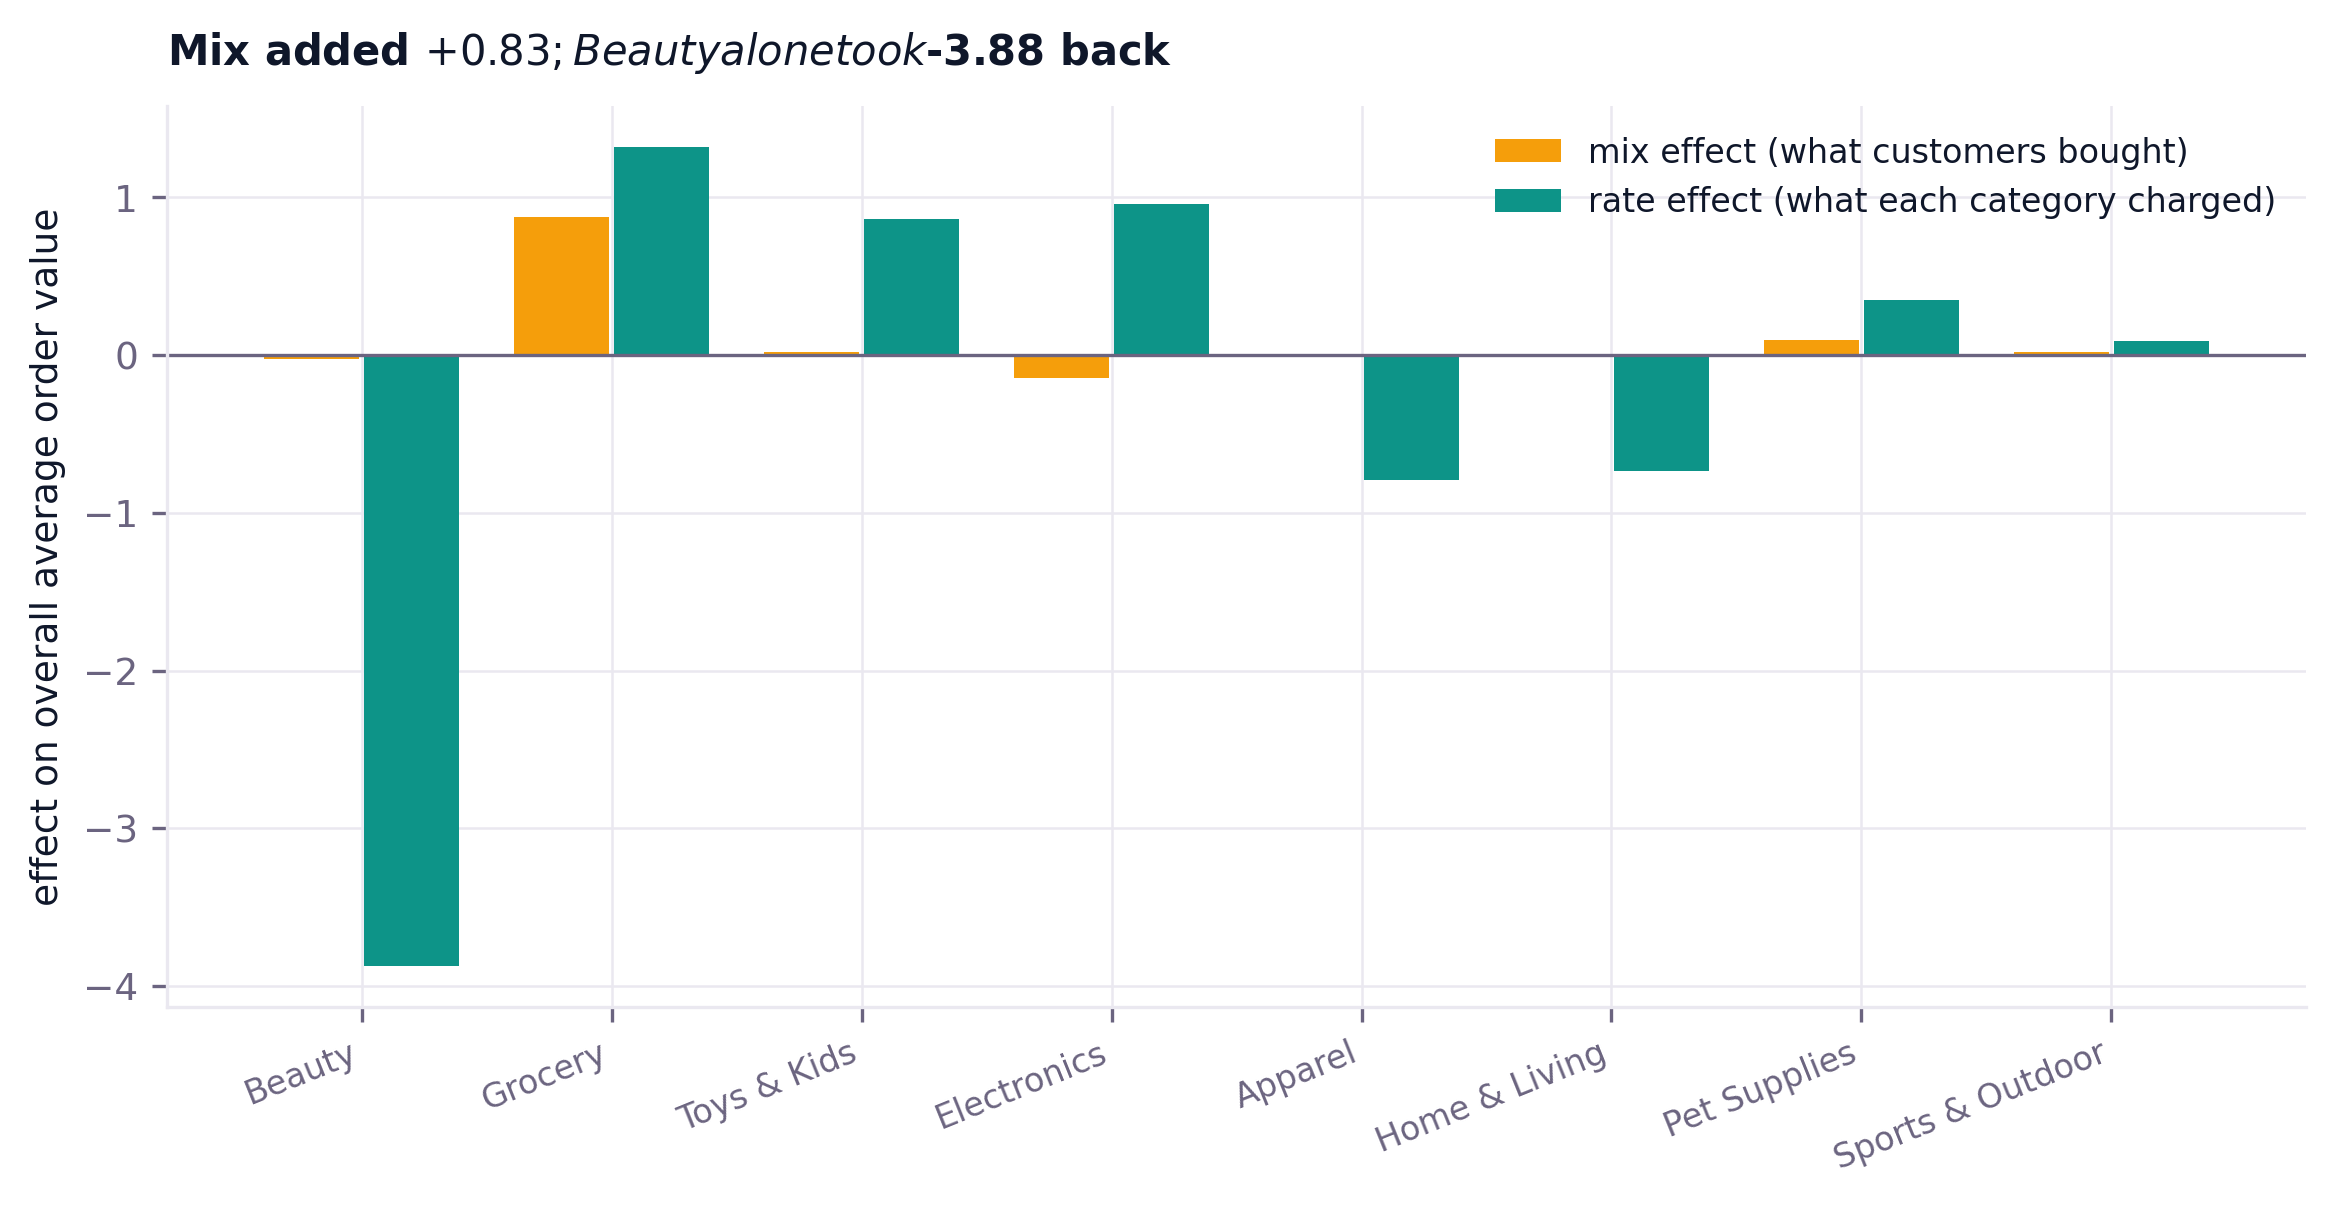
Beauty lost $29.04 of its own average order value, down 20 percent, contributing -$3.88 against a net rate effect of -$1.82. Five of eight categories raised their own average and it did not matter, because the three that fell carry 39 percent of orders. The action is to go and look at Beauty - which is not what a mix-shift headline on its own would have told anyone to do. A threshold on average order value would have fired on -$0.99 and said nothing about any of this.
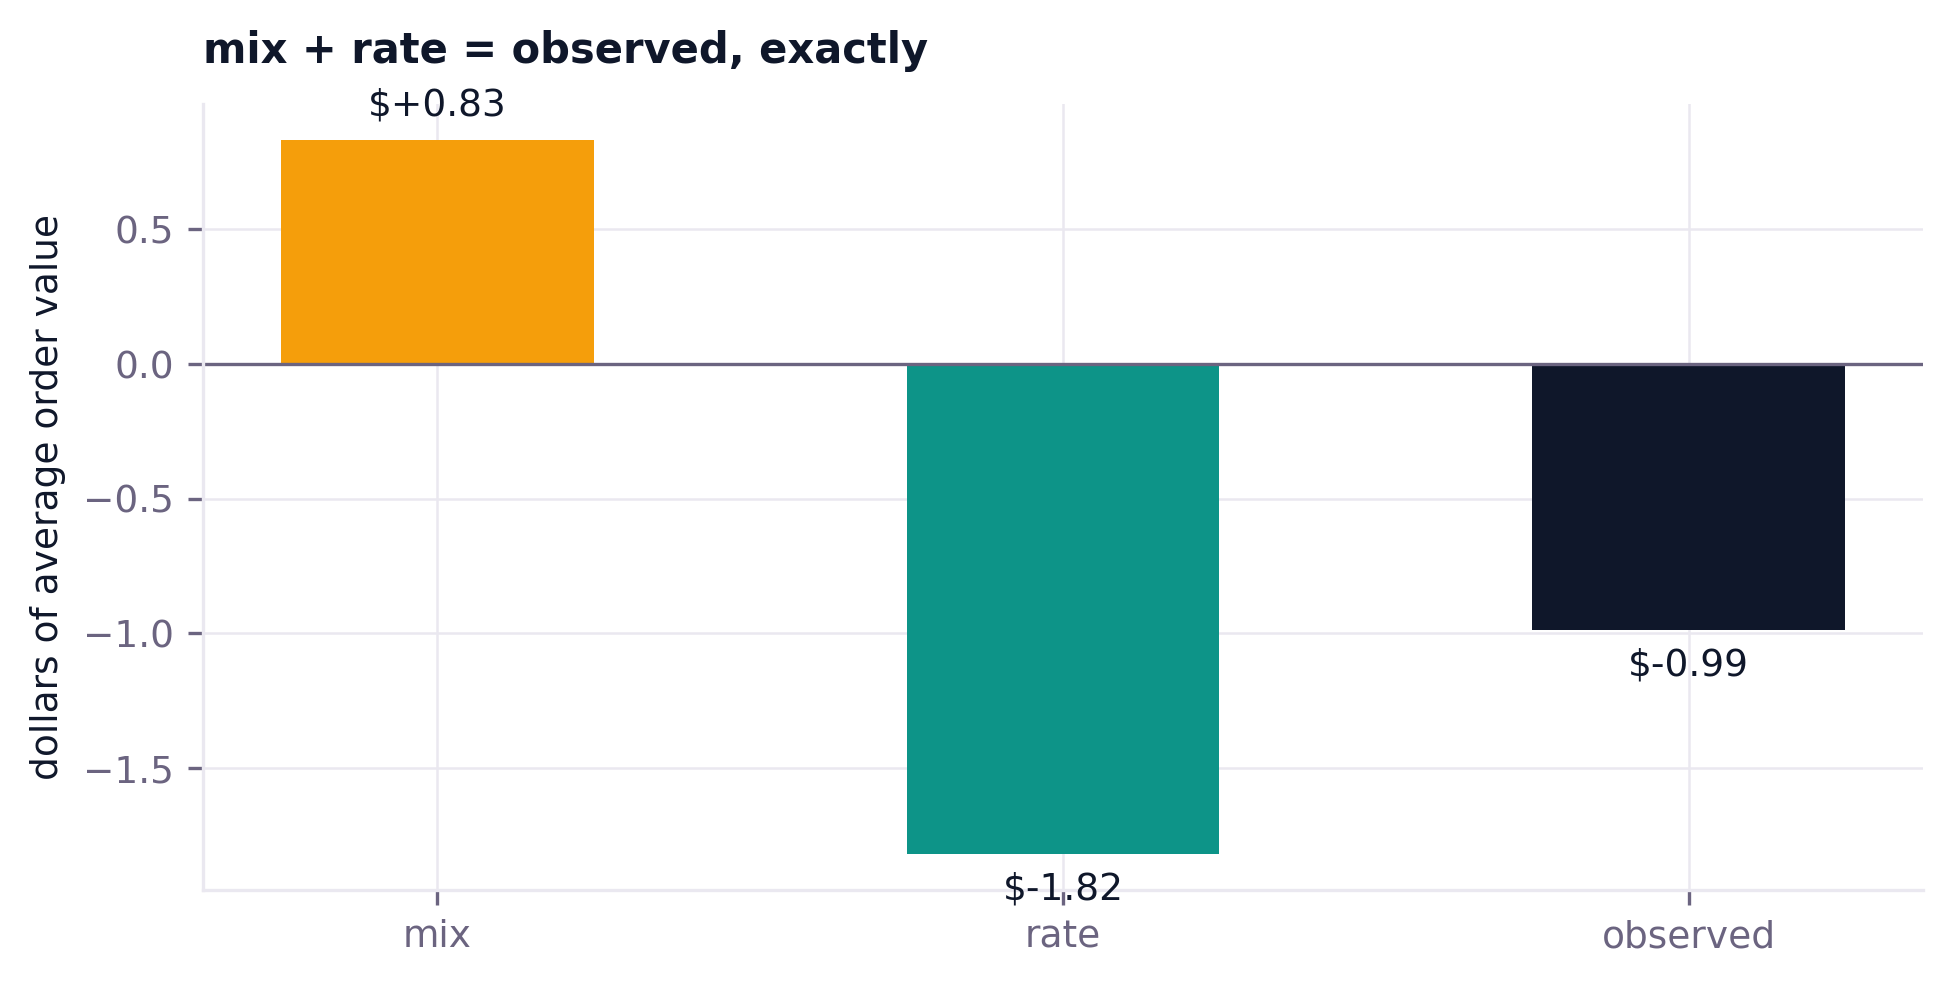
Both decompositions reconcile exactly - segment effects sum to the observed total to floating point, asserted in code against the source totals rather than against the frame built from them - so no slice can be dropped to make an argument.
A weekly digest whose every figure is computed, that shows the rows which actually crossed the threshold, and that states how often its own rule is wrong.
Five senior reviewer agents - 12 to 15 years each in detection theory, on-call observability, analytics leadership, data engineering and commercial P&L - were pointed at the code and the executed outputs. They did not describe defects; they ran them. One reviewer proved that a headline finding was an artifact of the build's own bug, and it was the finding the page had been built around.
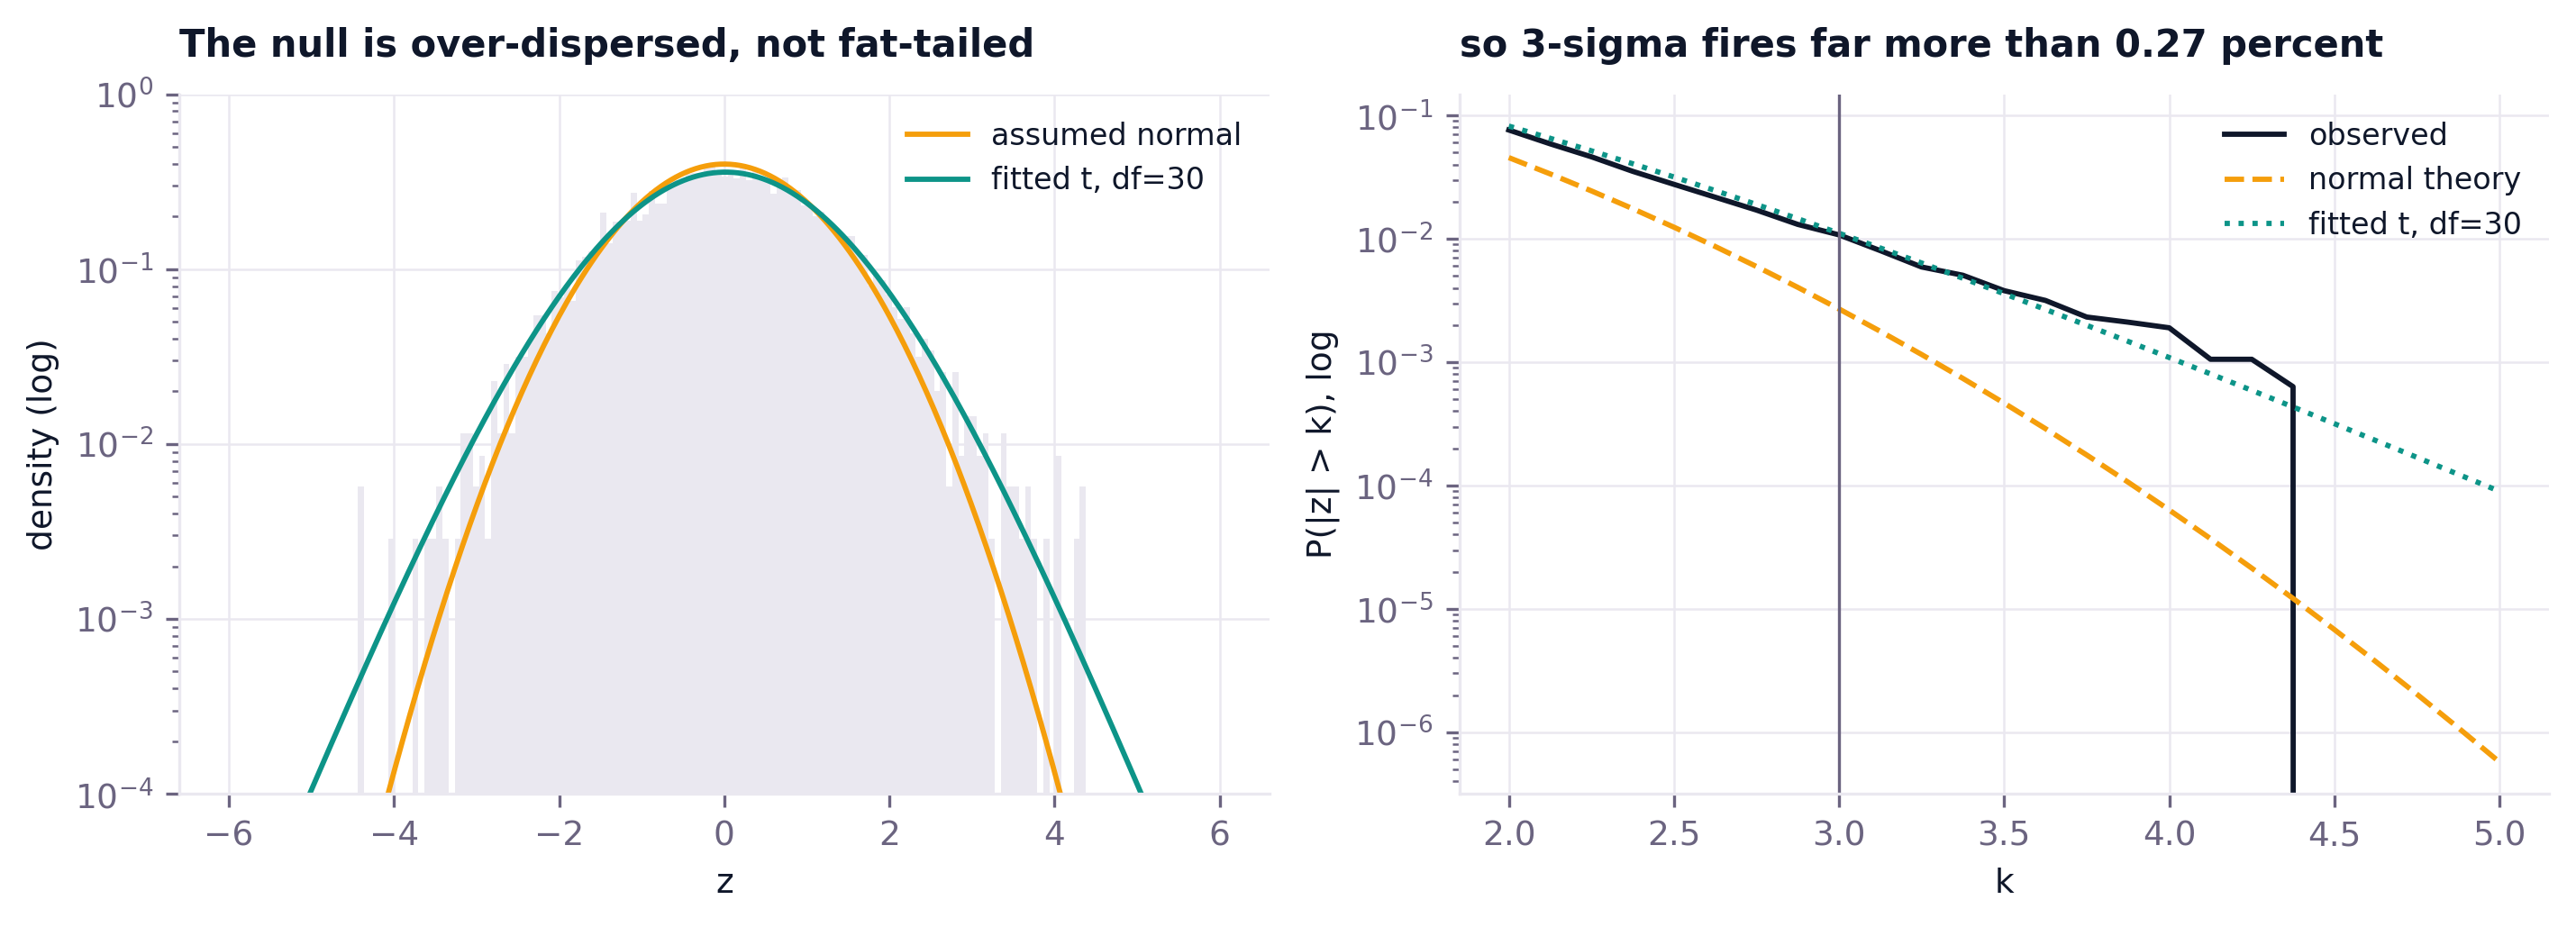
This page originally argued that a 3-sigma rule is badly miscalibrated because the null is heavy-tailed - fitted at about 3 degrees of freedom. It is not. The null was being fitted on the whole year including the planted changes, and because the shape anchor is the 99.5th percentile, two dozen incidents is exactly the amount of contamination that moves it. Fitted causally on trailing data with candidate events trimmed, the log-scale null comes back near-normal in shape, and the real residual problem turns out to be over-dispersion - z has a standard deviation of 1.13, not 1 - which the calibrated rung fixes by estimating the scale rather than assuming it. A null fitted on contaminated data widens to accommodate the incidents and then cannot see them - and it gets worse as the true incident rate rises.
"Your entire precision column is the injection coverage fraction. 12 injections of mean length 32 over 4,740 scoreable series-days is 7.56 percent, and D1's published precision matches that to four decimals. You are reading the base rate and calling it a detector property. Also: the null is fitted on the whole panel, so a November incident sets the threshold applied to the previous March."
score now returns base_rate and lift, computed from the panel width rather than the alert frame, and the page leads with them. The null is refitted every 28 days on a trailing 180-day window with candidates trimmed. Both changes are locked by regression tests."The digest prints one rung's measured error rates above a different rung's alerts. That is the single worst thing a page about honest error rates can do. And the table labelled 'largest deviations' contains no alerts at all - every row is sub-threshold, so an on-call opening this gets a leaderboard of non-events while the 13 real alerts appear nowhere."
render_digest now takes the detector callable and its name, derives the alerts itself, and asserts its observed rate against the bench row. Alerts and sub-threshold moves are separate sections, and the alert count is stated even when it is zero."Finding 25 is the page's conclusion and both halves of its causal story are the reverse of what the code computed. Mix is +$0.84 - it pushed AOV up - and it is written as a component of the drop. 'No category got worse at selling' is contradicted by three of eight, one of them by $29."
"The cadence sweep resamples with label='right', so the bucket stamped on the injection start covers the period before the change - 17 percent contamination at fortnightly, growing with exactly the variable you are comparing. And the fortnightly row is the mean of 9 replicates while every other row is 12; the only trace is three RuntimeWarnings on stderr."
label='left' with an explicit span test, injections moved past the slowest cadence's warmup, and the sweep now raises rather than silently dropping a replicate. Reruns verified byte-identical from a frozen snapshot."Every dollar here is GMV and not one word says so. '$132,060 of phantom revenue' in a room where revenue means the P&L line is a misstatement claim - the real number is $14.5k. And nothing was 'booked'; a duplicate load in an analytics mart is not a ledger entry."
TAKE_RATE constant, every headline figure quoted as GMV with the platform take beside it, and the March finding rewritten to name what actually needs reconciling downstream."No rung-to-rung comparison holds the alert budget fixed, so the ladder narrative is unidentified. And D6 does not correct for multiplicity, it relaxes the test - BH at q=0.05 over 15 tests is looser than alpha=0.0027 at every step, so the rung labelled 'multiplicity handled' doubles the false alarms."
Three findings are named on the page and in SKILL.md rather than resolved. There is no known-event calendar, so November still fires. There is no alert grouping, so every count here is an alert count and never an incident count. And per-alert precision still rewards a detector for staying on - an episode-level figure is computed alongside it, but the ladder table reports both rather than pretending the question is settled.
Point monitor.py at a CSV of daily series. It prints the suitability report first - which series are dense enough to monitor at all - then the fitted null, then the alerts. The suitability report is the part to read.
/plugin marketplace add phoebefu6/phoebe-data-skills /plugin install how-to-biz-monitoring@phoebe-data-skills