Skill walkthrough

how-to-EDA-using-claude-python

One decision question, one complex retail platform, six steps. Every chart below came from a real run - seed 42, learn-python env, 233,835 rows generated and analyzed.

Case: Everrest · B2B2C retail platform seed = 42 pandas · matplotlib · seaborn · statsmodels 12 chart types 6 findings, $-ranked
01
Step 1

Input - schema + business context

Everrest is a B2B2C retail platform: 400 merchants and brands sell to 20,000 consumers through one Southeast Asian marketplace. The category team hands over 8 tables and one line of context: "tell us what to act on this quarter." That is all EDA needs to start - the discipline is refusing to write code before understanding what the business would pay to know.

orders 50,600 rows
  • order_id · pk
  • customer_id · fk
  • merchant_id · fk
  • order_ts · timestamp
  • status · delivered/shipped/paid/cancelled
order_items 109,154 rows
  • order_id · fk
  • product_id · fk
  • qty · int
  • unit_price · numeric
  • discount · 0 to 0.20
payments 46,003 rows
  • payment_id · pk
  • order_id · fk
  • method · card/wallet/bnpl/cod/bank
  • amount · numeric
  • paid_ts · timestamp
merchants 400 rows
  • merchant_id · pk
  • category · 8 retail categories
  • tier · standard/premium/enterprise
  • joined_at · date
customers 20,000 rows
  • customer_id · pk
  • signup_date · date
  • channel_id · fk, 6 channels
  • region · SG/MY/ID/TH/VN/PH
products 5,000 rows
  • product_id · pk
  • merchant_id · fk
  • category · enum
  • price · numeric
returns 2,672 rows
  • return_id · pk
  • order_id · fk
  • reason · 5 reasons
  • return_ts · timestamp
channels 6 rows
  • channel_id · pk
  • name · organic, paid search, social, email, referral, affiliate
02
Step 2

Generate sample data - with planted quirks

A seeded generator builds all 8 tables - 233,835 rows, identical on every run. Five problems are planted on purpose, because EDA that finds nothing teaches nothing. Each quirk is documented in the generator's docstring, which turns Step 5 into a recall test: did the analysis catch everything we hid?

generate_everrest.py ↗ · excerpt (full script on GitHub)
import numpy as np
import pandas as pd

SEED = 42
rng = np.random.default_rng(SEED)

# Quirk 1: affiliate-channel tracker drops `method` -> nulls concentrate there.
p_null = np.where(order_channel == "affiliate", 0.55, 0.035)
df.loc[rng.random(len(df)) < p_null, "method"] = np.nan

# Quirk 3: retry bug double-fires ~600 March-2026 orders (exact dup rows).
march = df[df.order_ts.dt.to_period("M") == "2026-03"]
df = pd.concat([df, march.sample(600, random_state=SEED)])

# Quirk 4: weekly cycle (weekend lift) + November promo spike (~2.2x).
dow_weight = np.where(days.dayofweek >= 5, 1.45, 1.0)
nov_weight = np.where(days.month == 11, 2.2, 1.0)
🕳 Missing not-at-randompayments.method null 55% on affiliate channel vs 3.5% elsewhere
📈 Outlier merchantM0007 "Summit Wholesale Co" - bulk pallets at ~59x median order value
👯 Duplicates600 orders double-fired by a March 2026 retry bug
🌊 SeasonalityWeekend lift ~40% + November promo spike 2.1x
🚩 Suspicious segmentPremium-tier merchants return ~4x more than any other tier
03
Step 3

Objective - a decision question, not a technique

Framing before code. Not "run describe()" - a question a category lead would actually pay to answer. Every chart in Step 5 must serve one of the five sub-questions; anything else is decoration and gets cut.

What should Everrest's category team act on this quarter - and what in this data can't be trusted yet?
  • Where is revenue concentrated - and is that concentration healthy?
  • Which data quality issues would silently corrupt any dashboard built on this?
  • What does the weekly/seasonal demand rhythm mean for inventory and staffing?
  • Which merchant segment behaves abnormally, and is it fraud or a data artifact?
  • Which customer segments deserve a retention play?
04
Step 4

Find-skills - Claude assembles its toolbox

Before writing code, Claude scans its installed skills and tools and picks the ones that serve this objective. Reuse beats rebuilding - the point of a skill shelf is that the next analysis starts from here, not from zero.

OSS tool

ydata-profiling

One-shot profile report: types, missingness, correlations - the 10-minute head start before custom analysis.

OSS tool

Great Expectations

Turns the quirks EDA finds into permanent data quality gates - the duplicate bug never ships twice.

Claude skill

dataviz discipline

Chart form chosen by relationship: trend=line, comparison=bar, distribution=histogram; max 2-3 series colors.

Claude skill

schema-to-insights playbook

Decision-first scan pattern: rank findings by dollar impact, not by p-value.

05
Step 5

Code + charts - the real run

One sectioned script, data-quality gate first, business questions on the clean data second. 12 chart types, every PNG rendered at 300 DPI from the actual run, every title a finding rather than a technique. Grab the real code below - one click, copy, run.

eda_everrest_v2.py ↗ · the DQ gate (excerpt)
# Gate 1: exact duplicate order rows (retry bug).
dupes = orders_raw[orders_raw.duplicated()]
dup_inflation = order_value.reindex(dupes.order_id).sum()
orders = orders_raw.drop_duplicates().copy()

# Gate 2: cancelled orders carry no revenue.
rev_orders = orders[orders.status != "cancelled"]

# Missingness BY SEGMENT - this is how missing-not-at-random shows up.
null_by_ch = pay.groupby("channel_id").method.apply(lambda s: s.isna().mean() * 100)
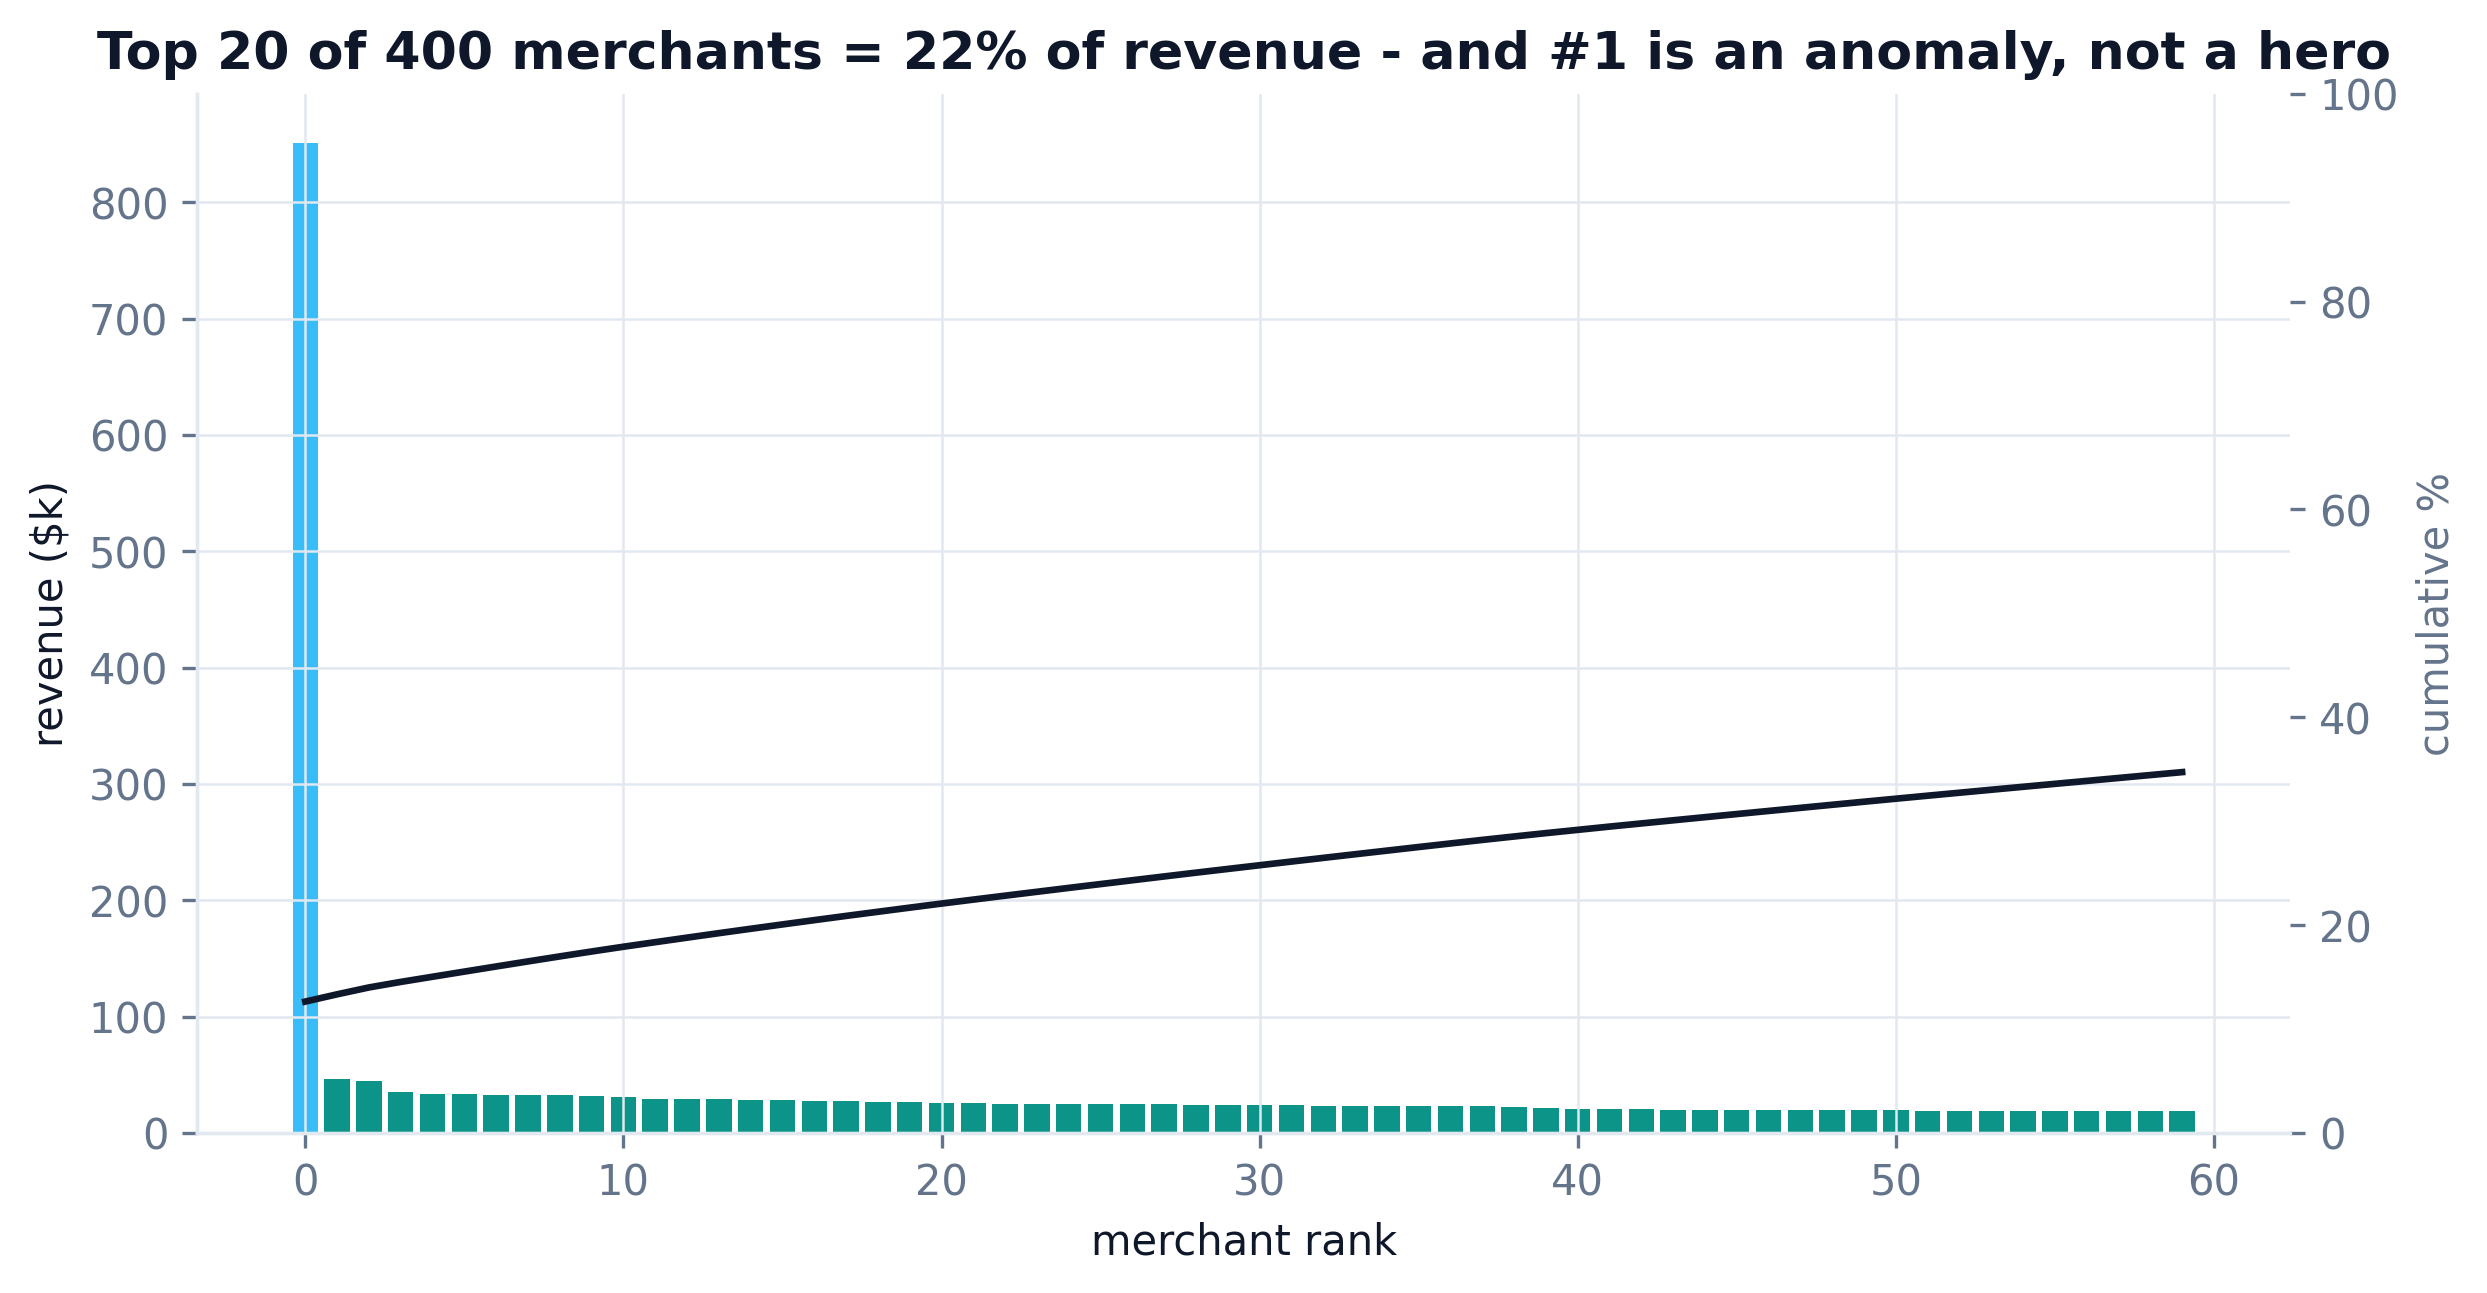
Pareto chart: top 20 of 400 merchants account for the majority of revenue, rank 1 highlighted as anomaly
Concentration. Top 20 of 400 merchants carry most of the revenue - and rank #1 is an anomaly, not a hero.
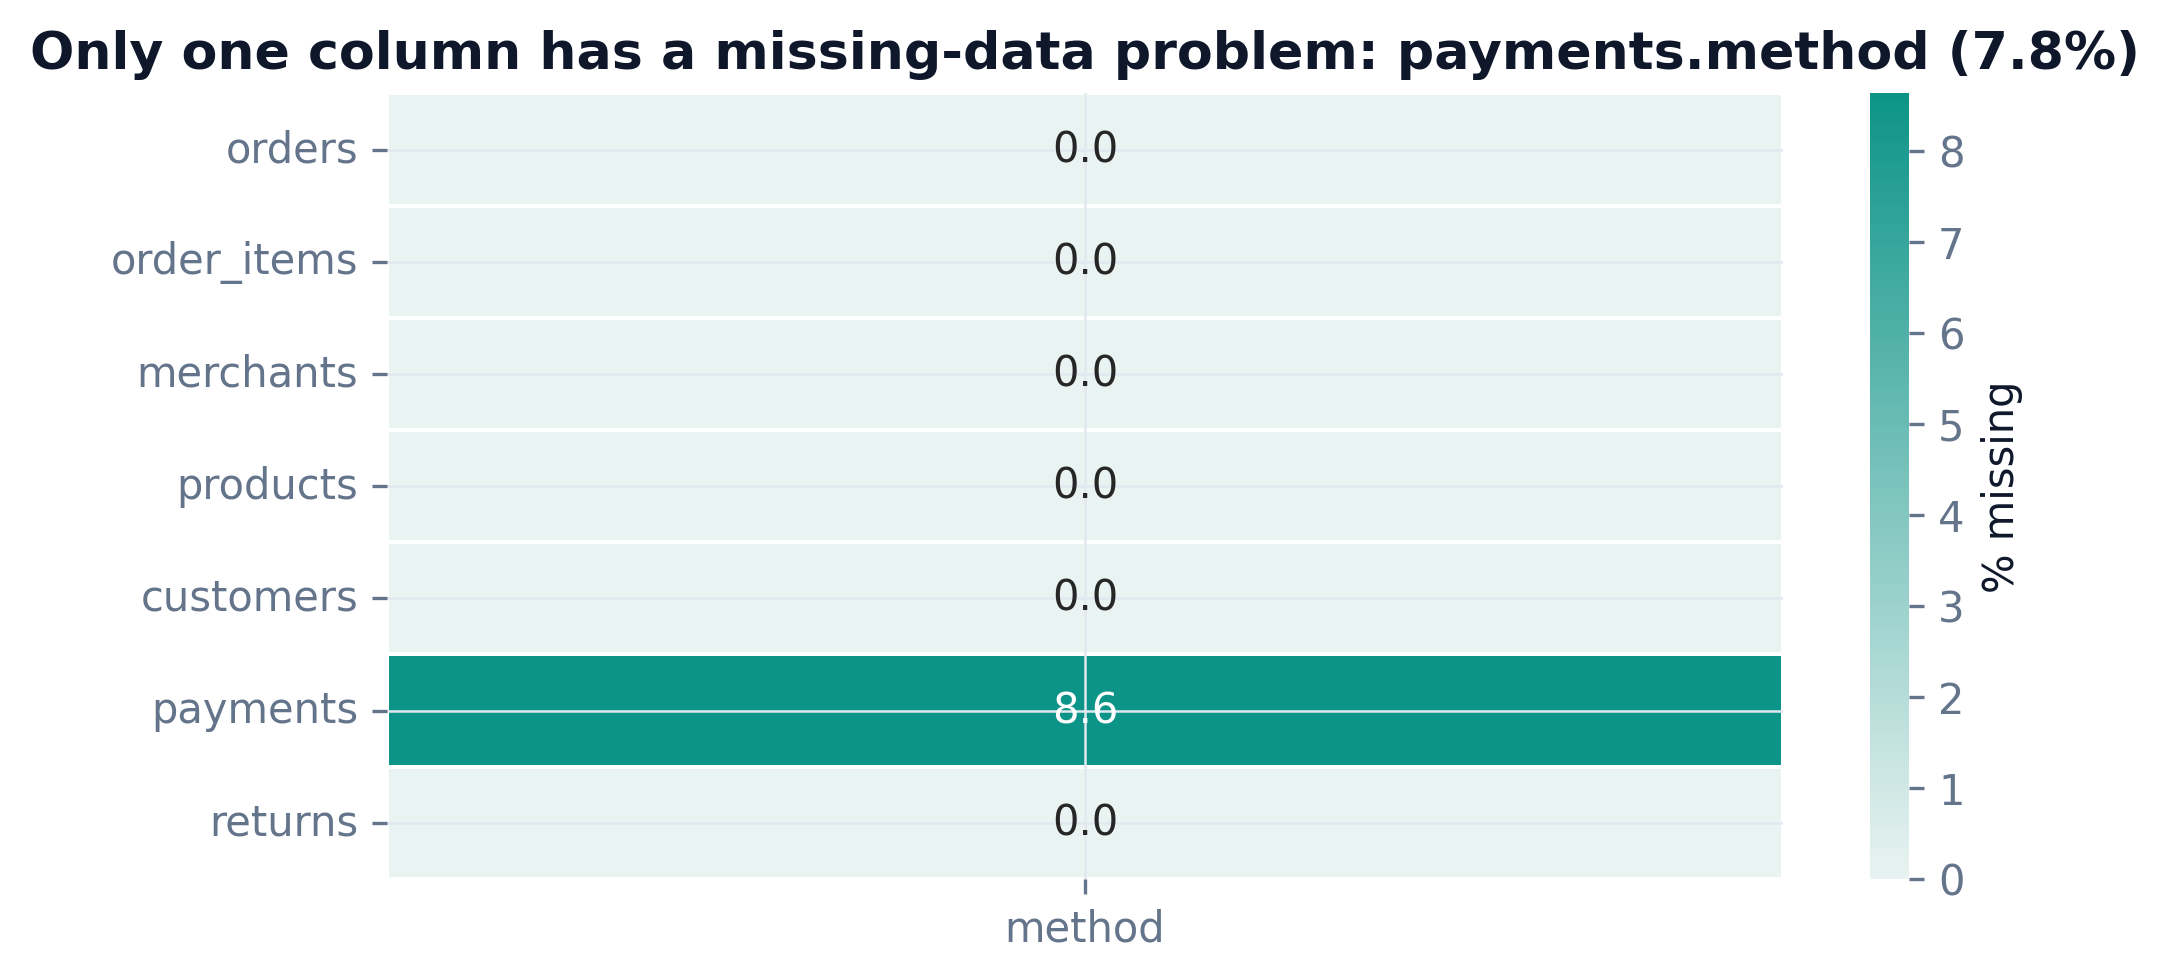
Heatmap of missing values by table and column, payments.method at 7.8 percent
Trust check. Exactly one column has a missing-data problem: payments.method at 7.8%.
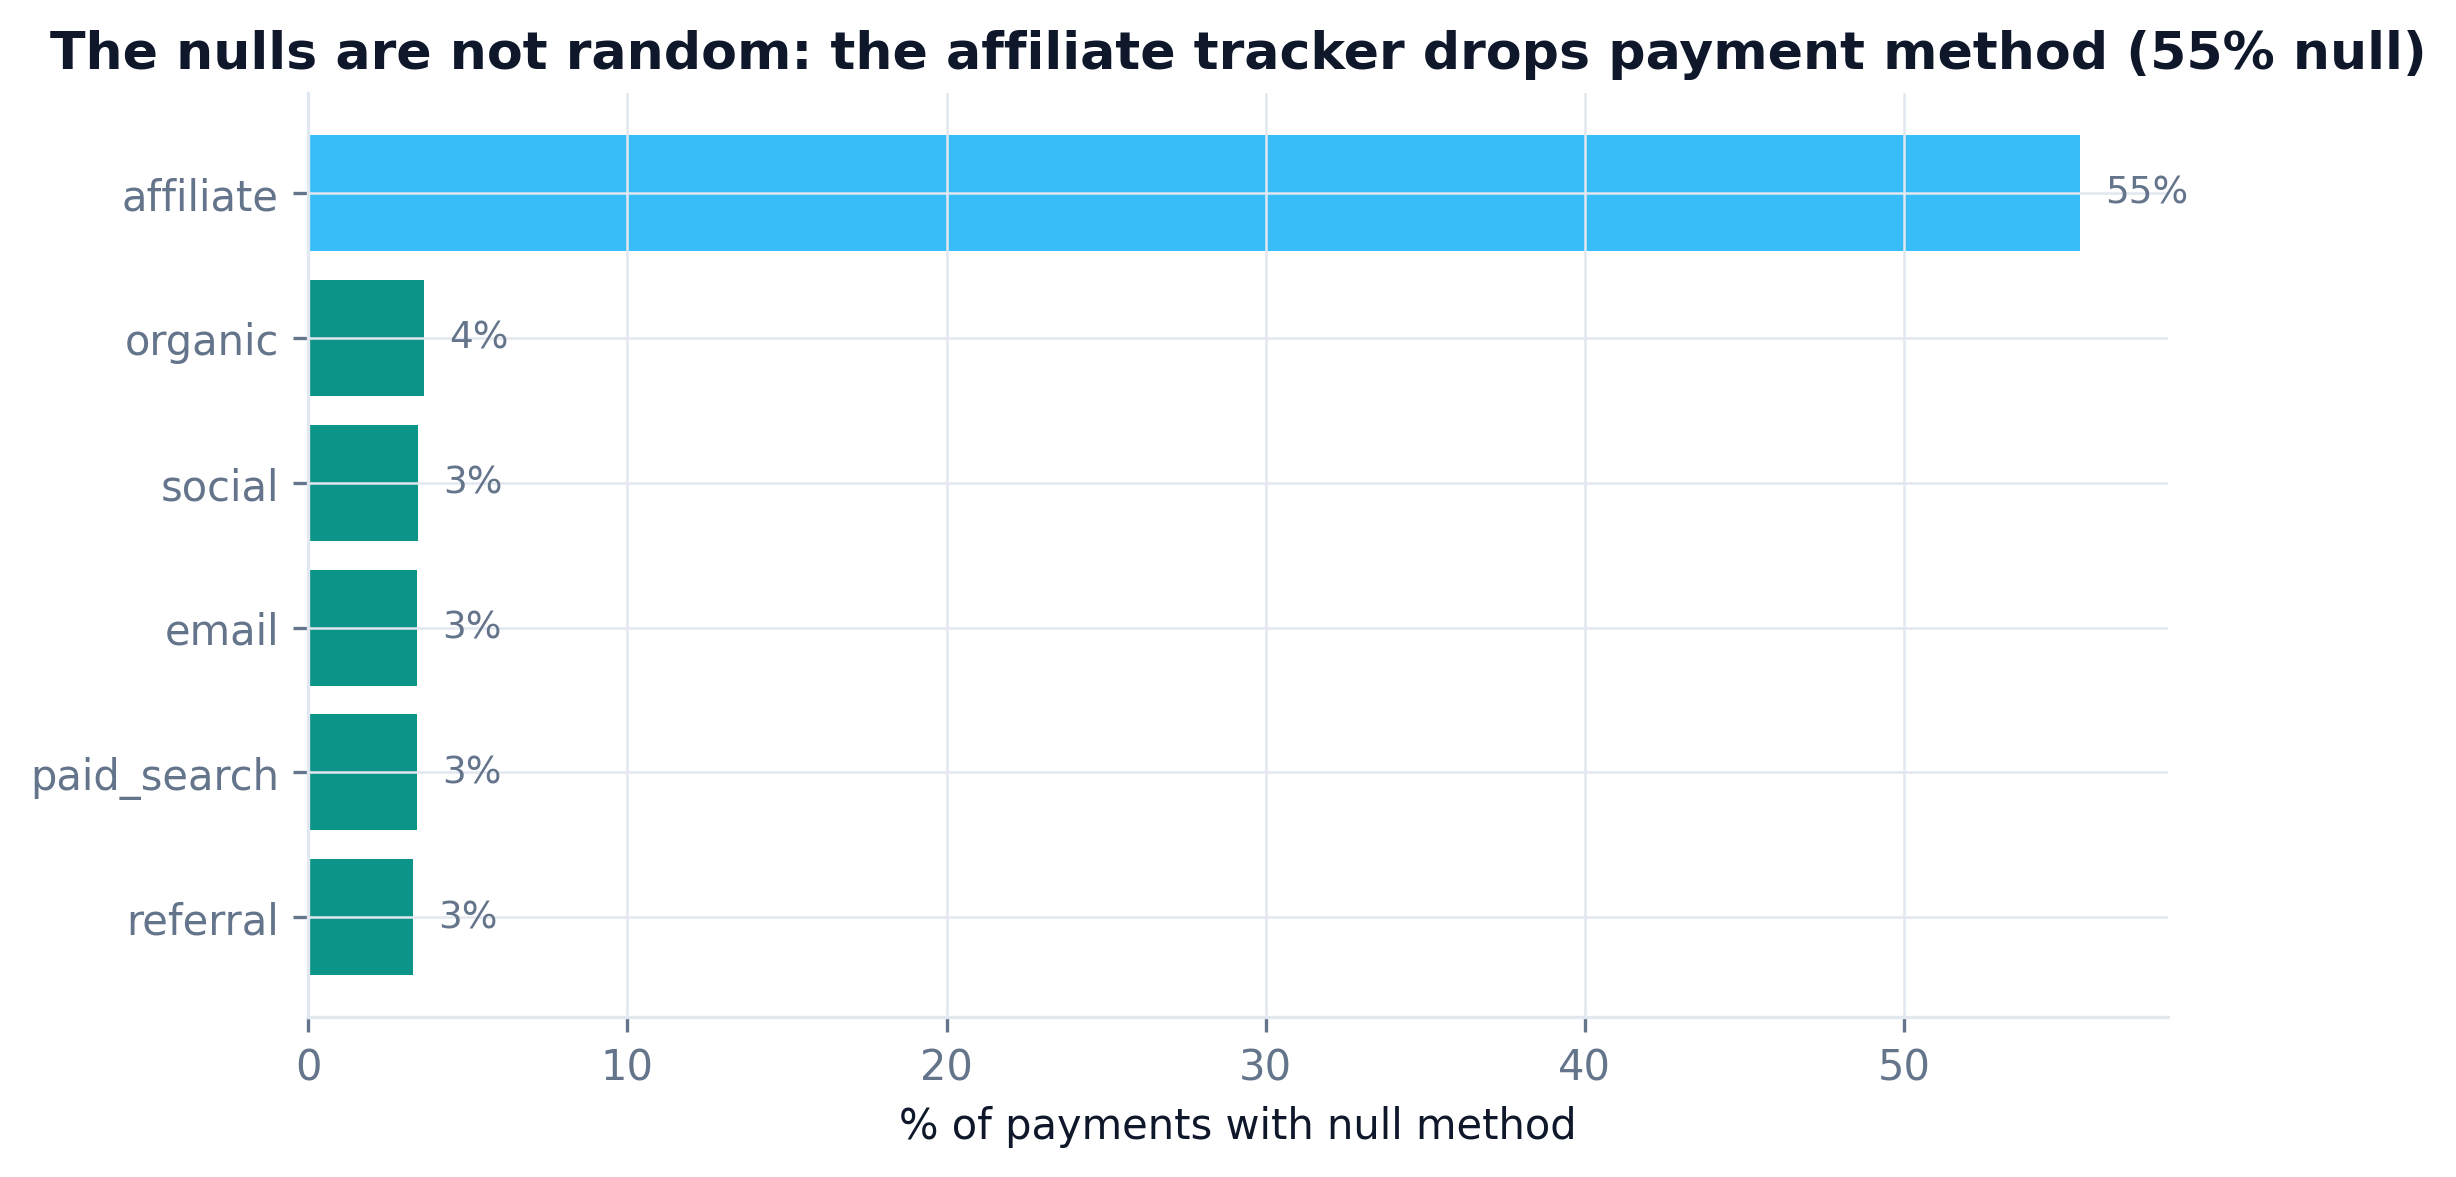
Bar chart: affiliate channel has 55 percent null payment methods vs about 3.5 percent elsewhere
Not random. The nulls concentrate on the affiliate channel - a broken tracker, not user behaviour. $578k of GMV unattributable.
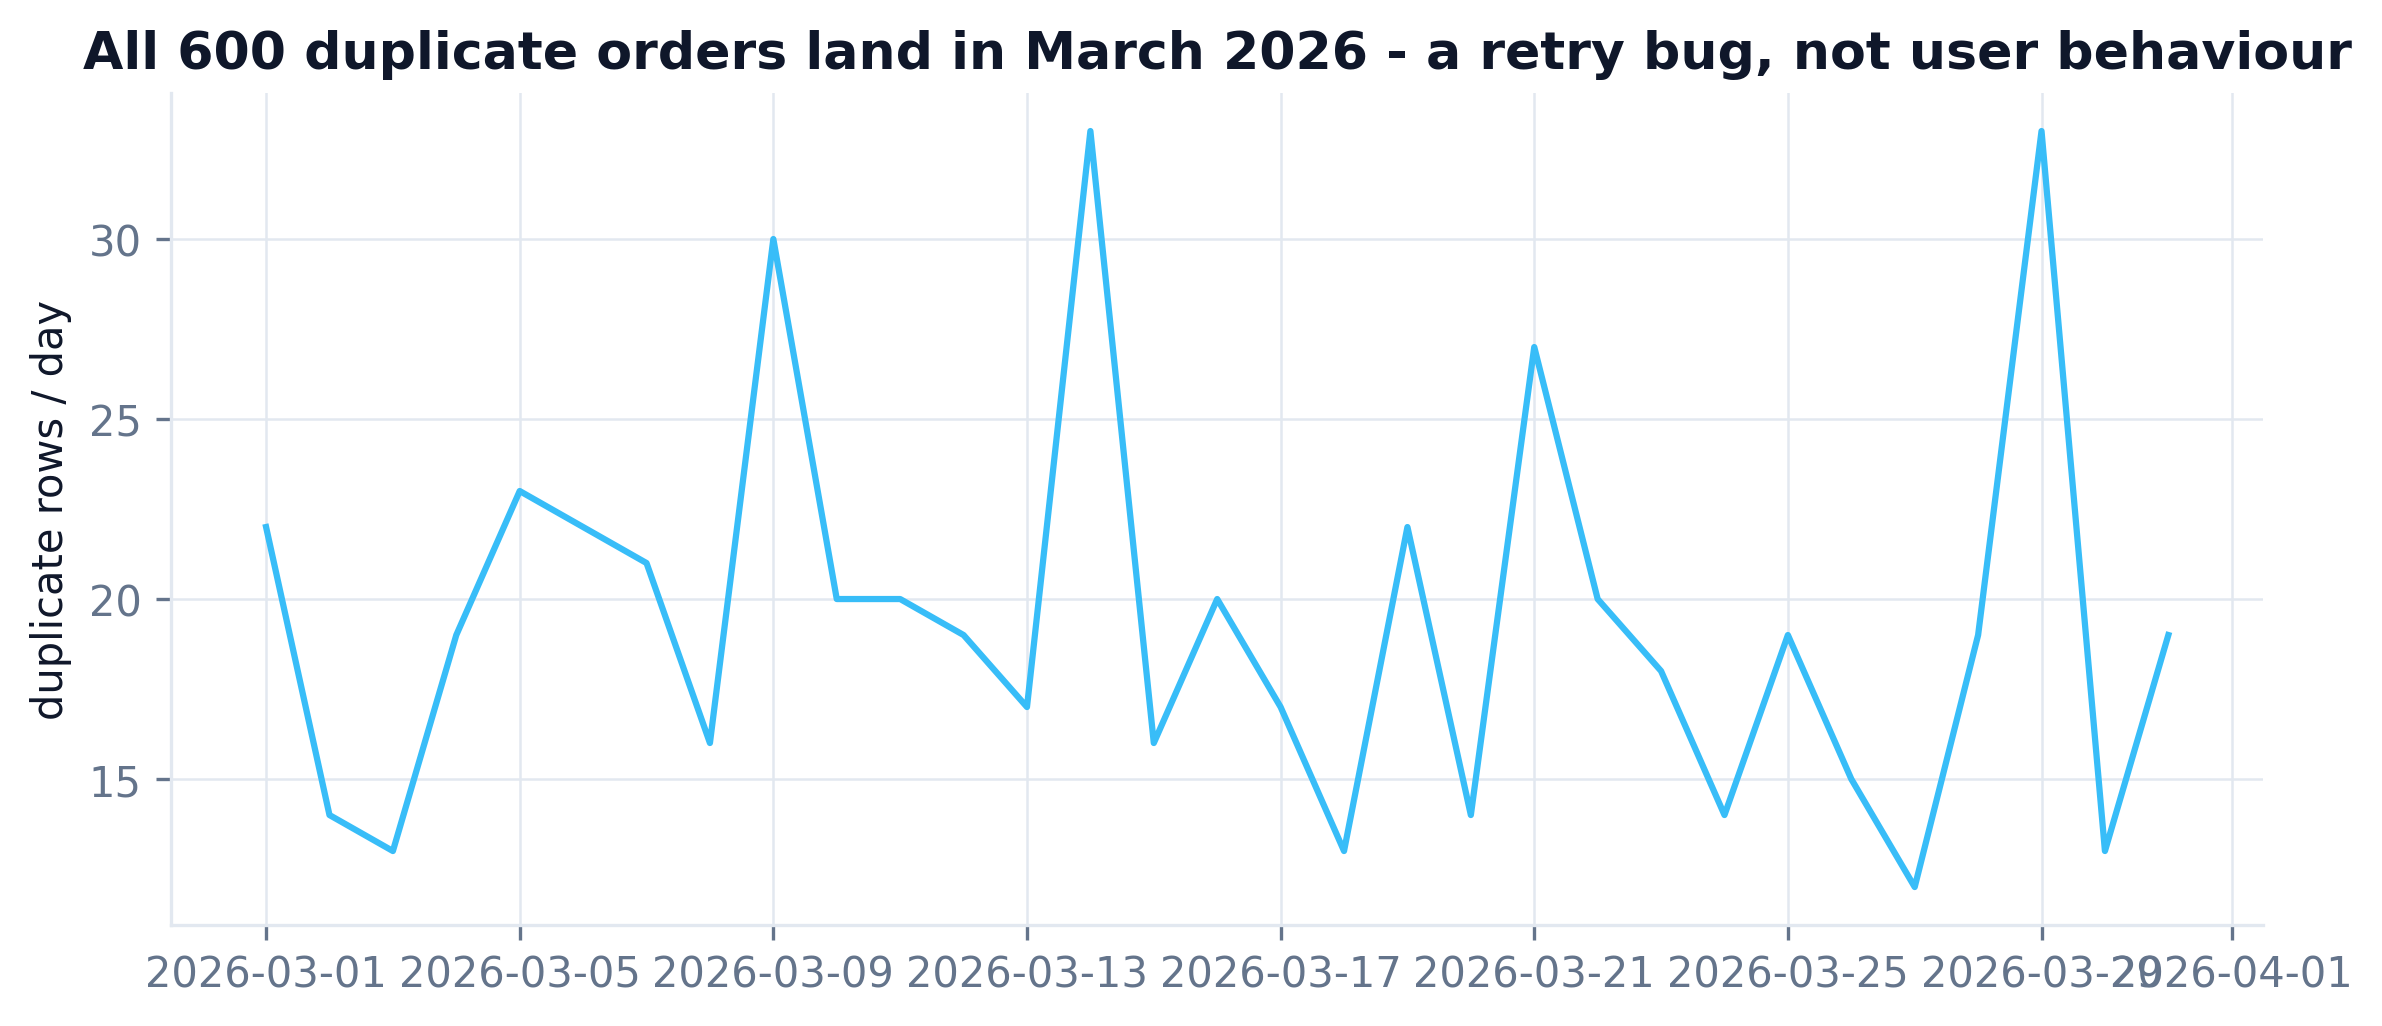
Line chart: all 600 duplicate orders occur in March 2026
Retry bug. All 600 duplicate rows land in March 2026 - $155k of phantom revenue in any naive aggregate.
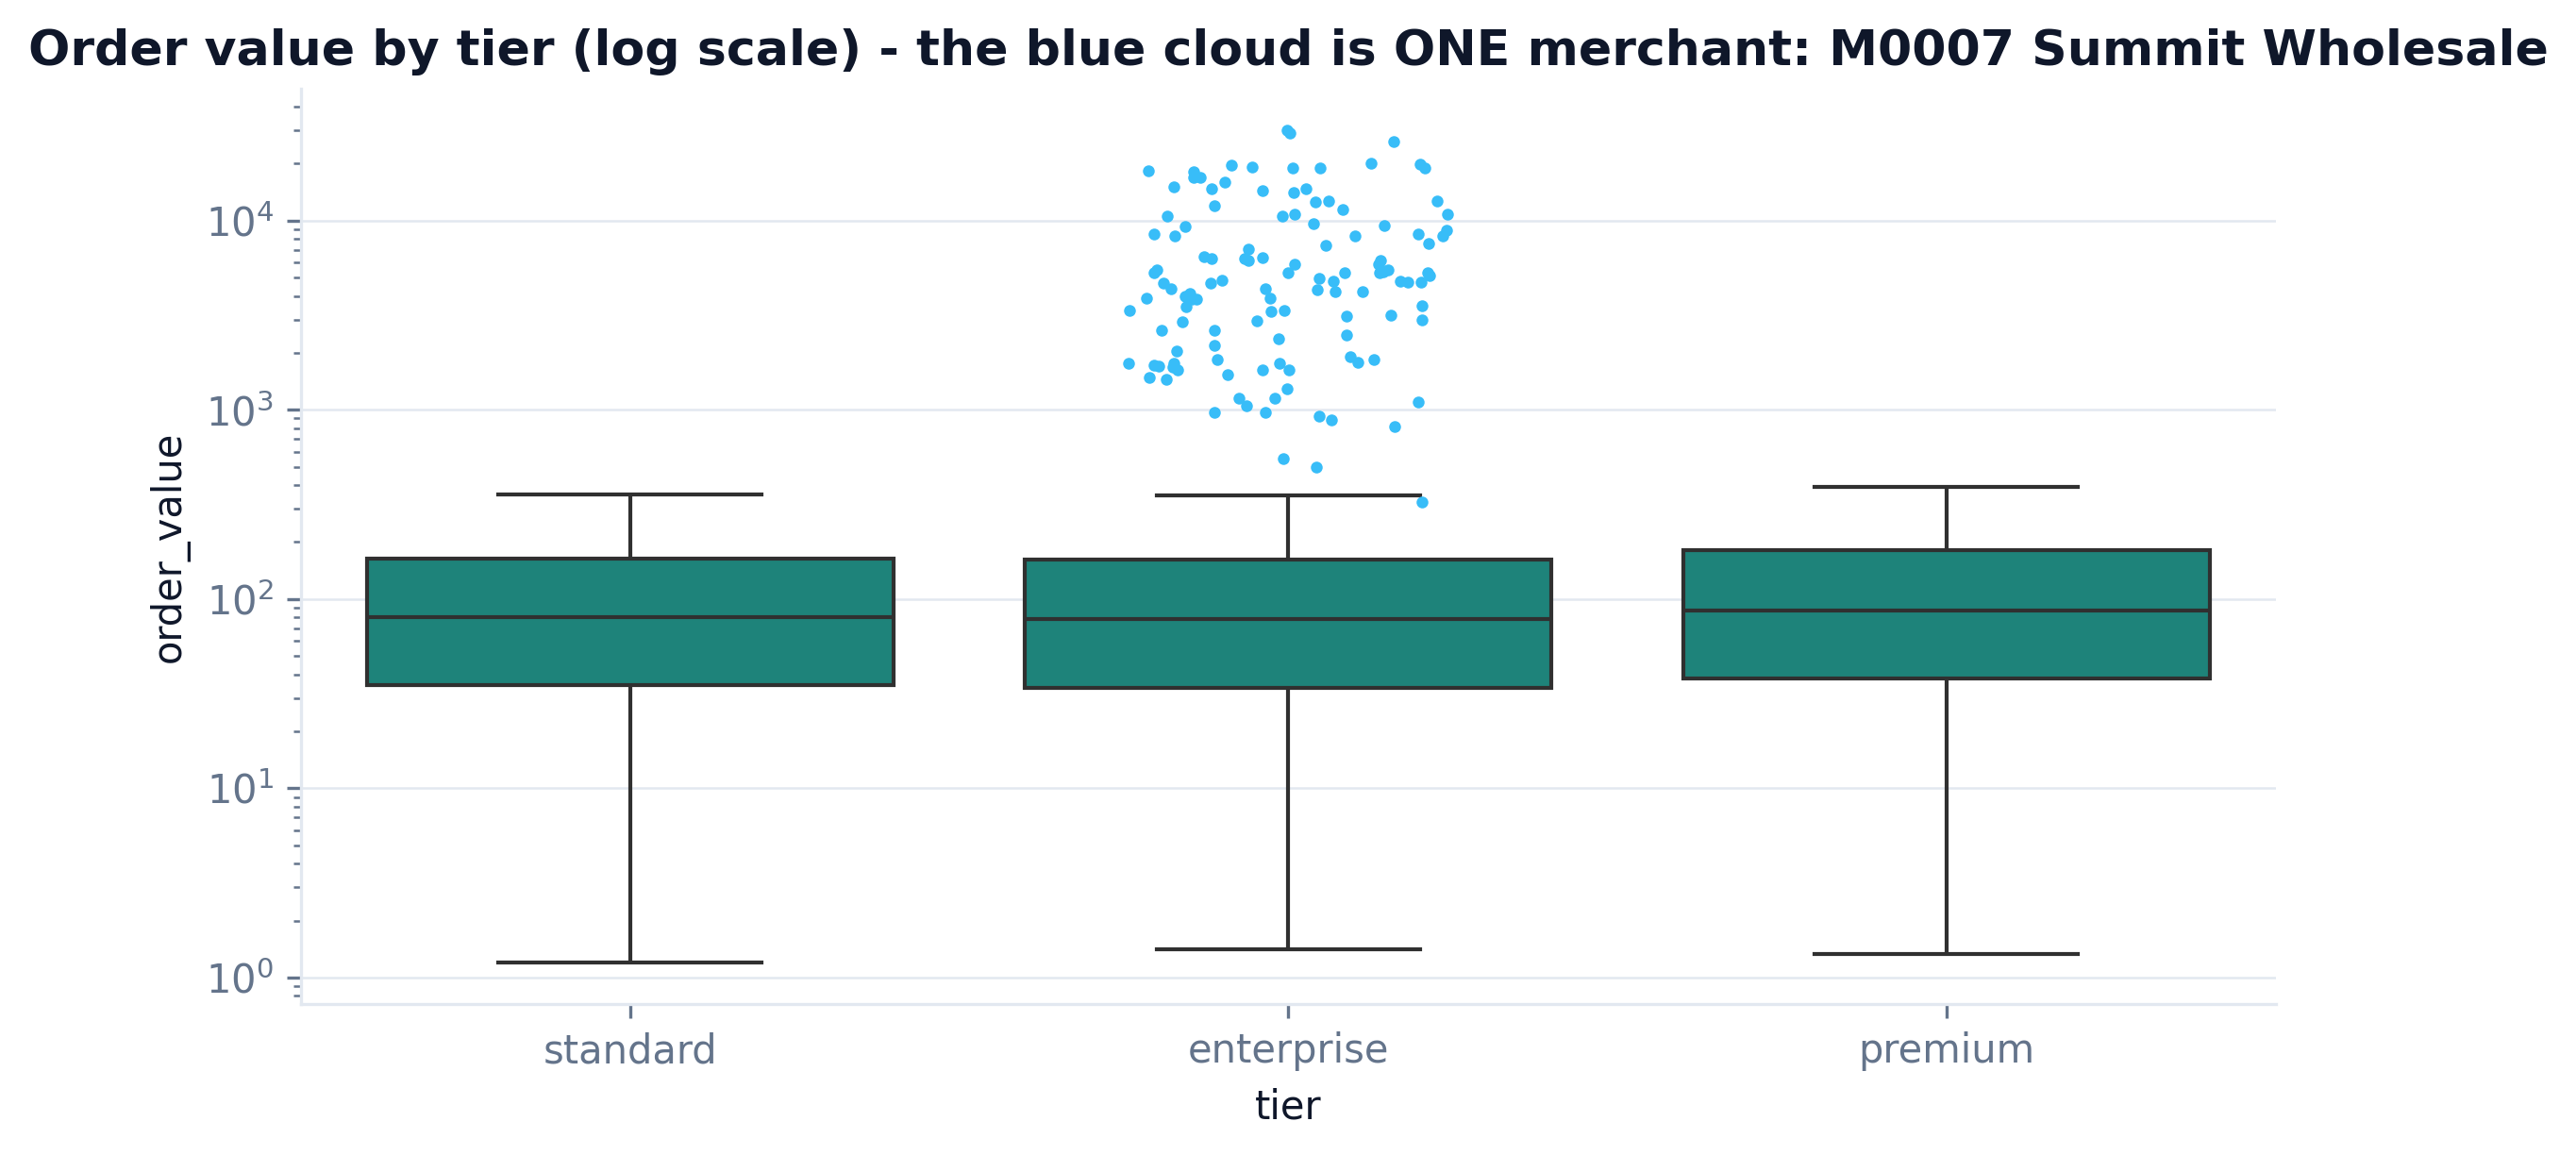
Box plot of order value by tier on log scale, one merchant's orders form a separate cloud
The blue cloud is ONE merchant. M0007 "Summit Wholesale Co" - median order $4,790 vs $82 platform-wide.
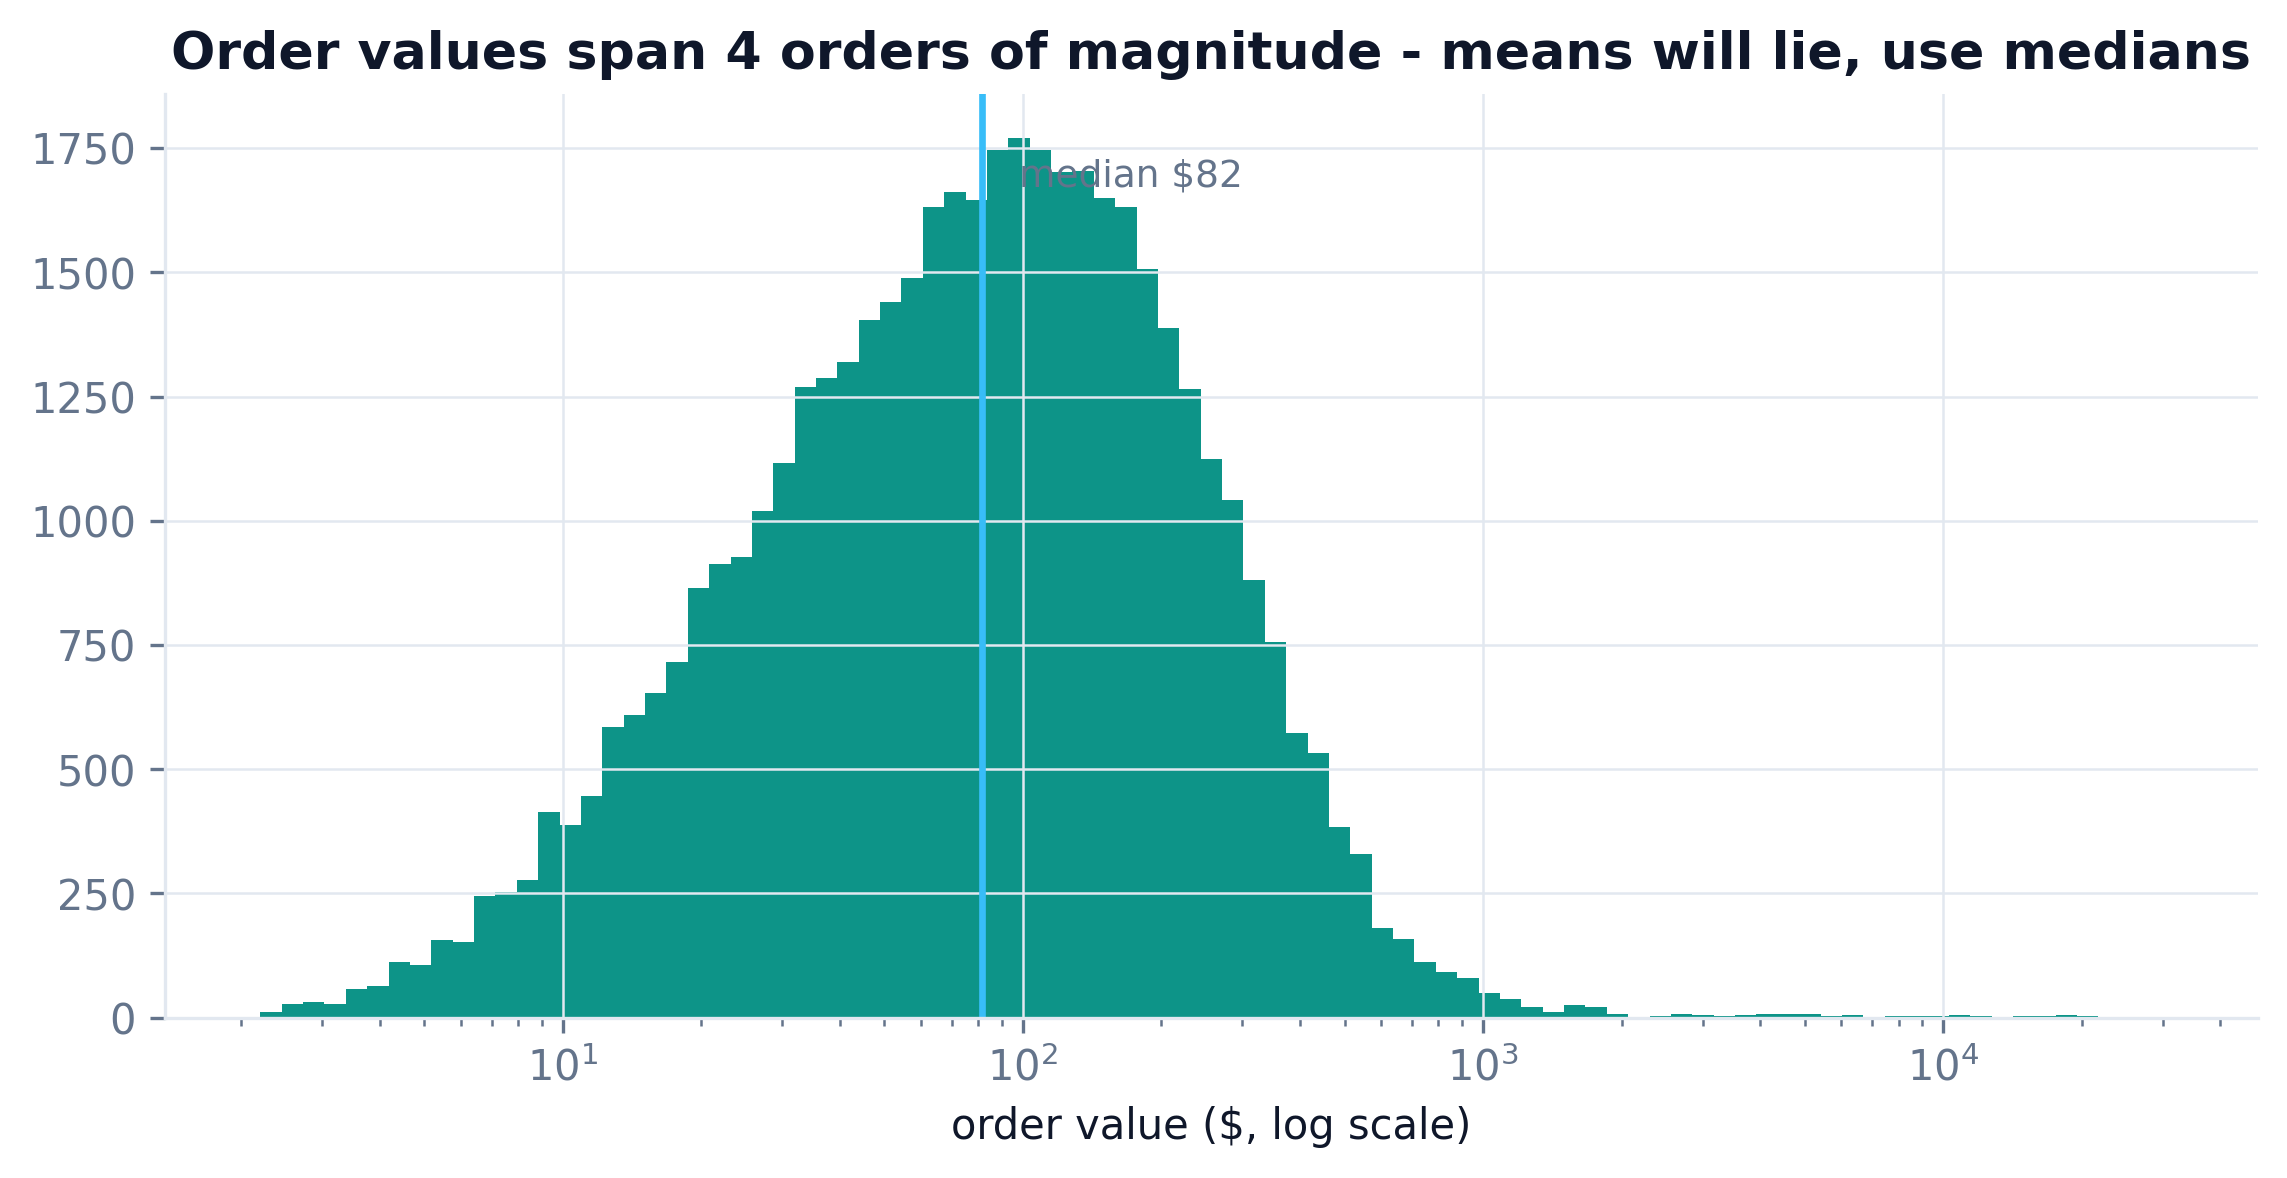
Histogram of order values on log scale with median marker at 82 dollars
Skew. Order values span 4 orders of magnitude - means will lie, use medians.
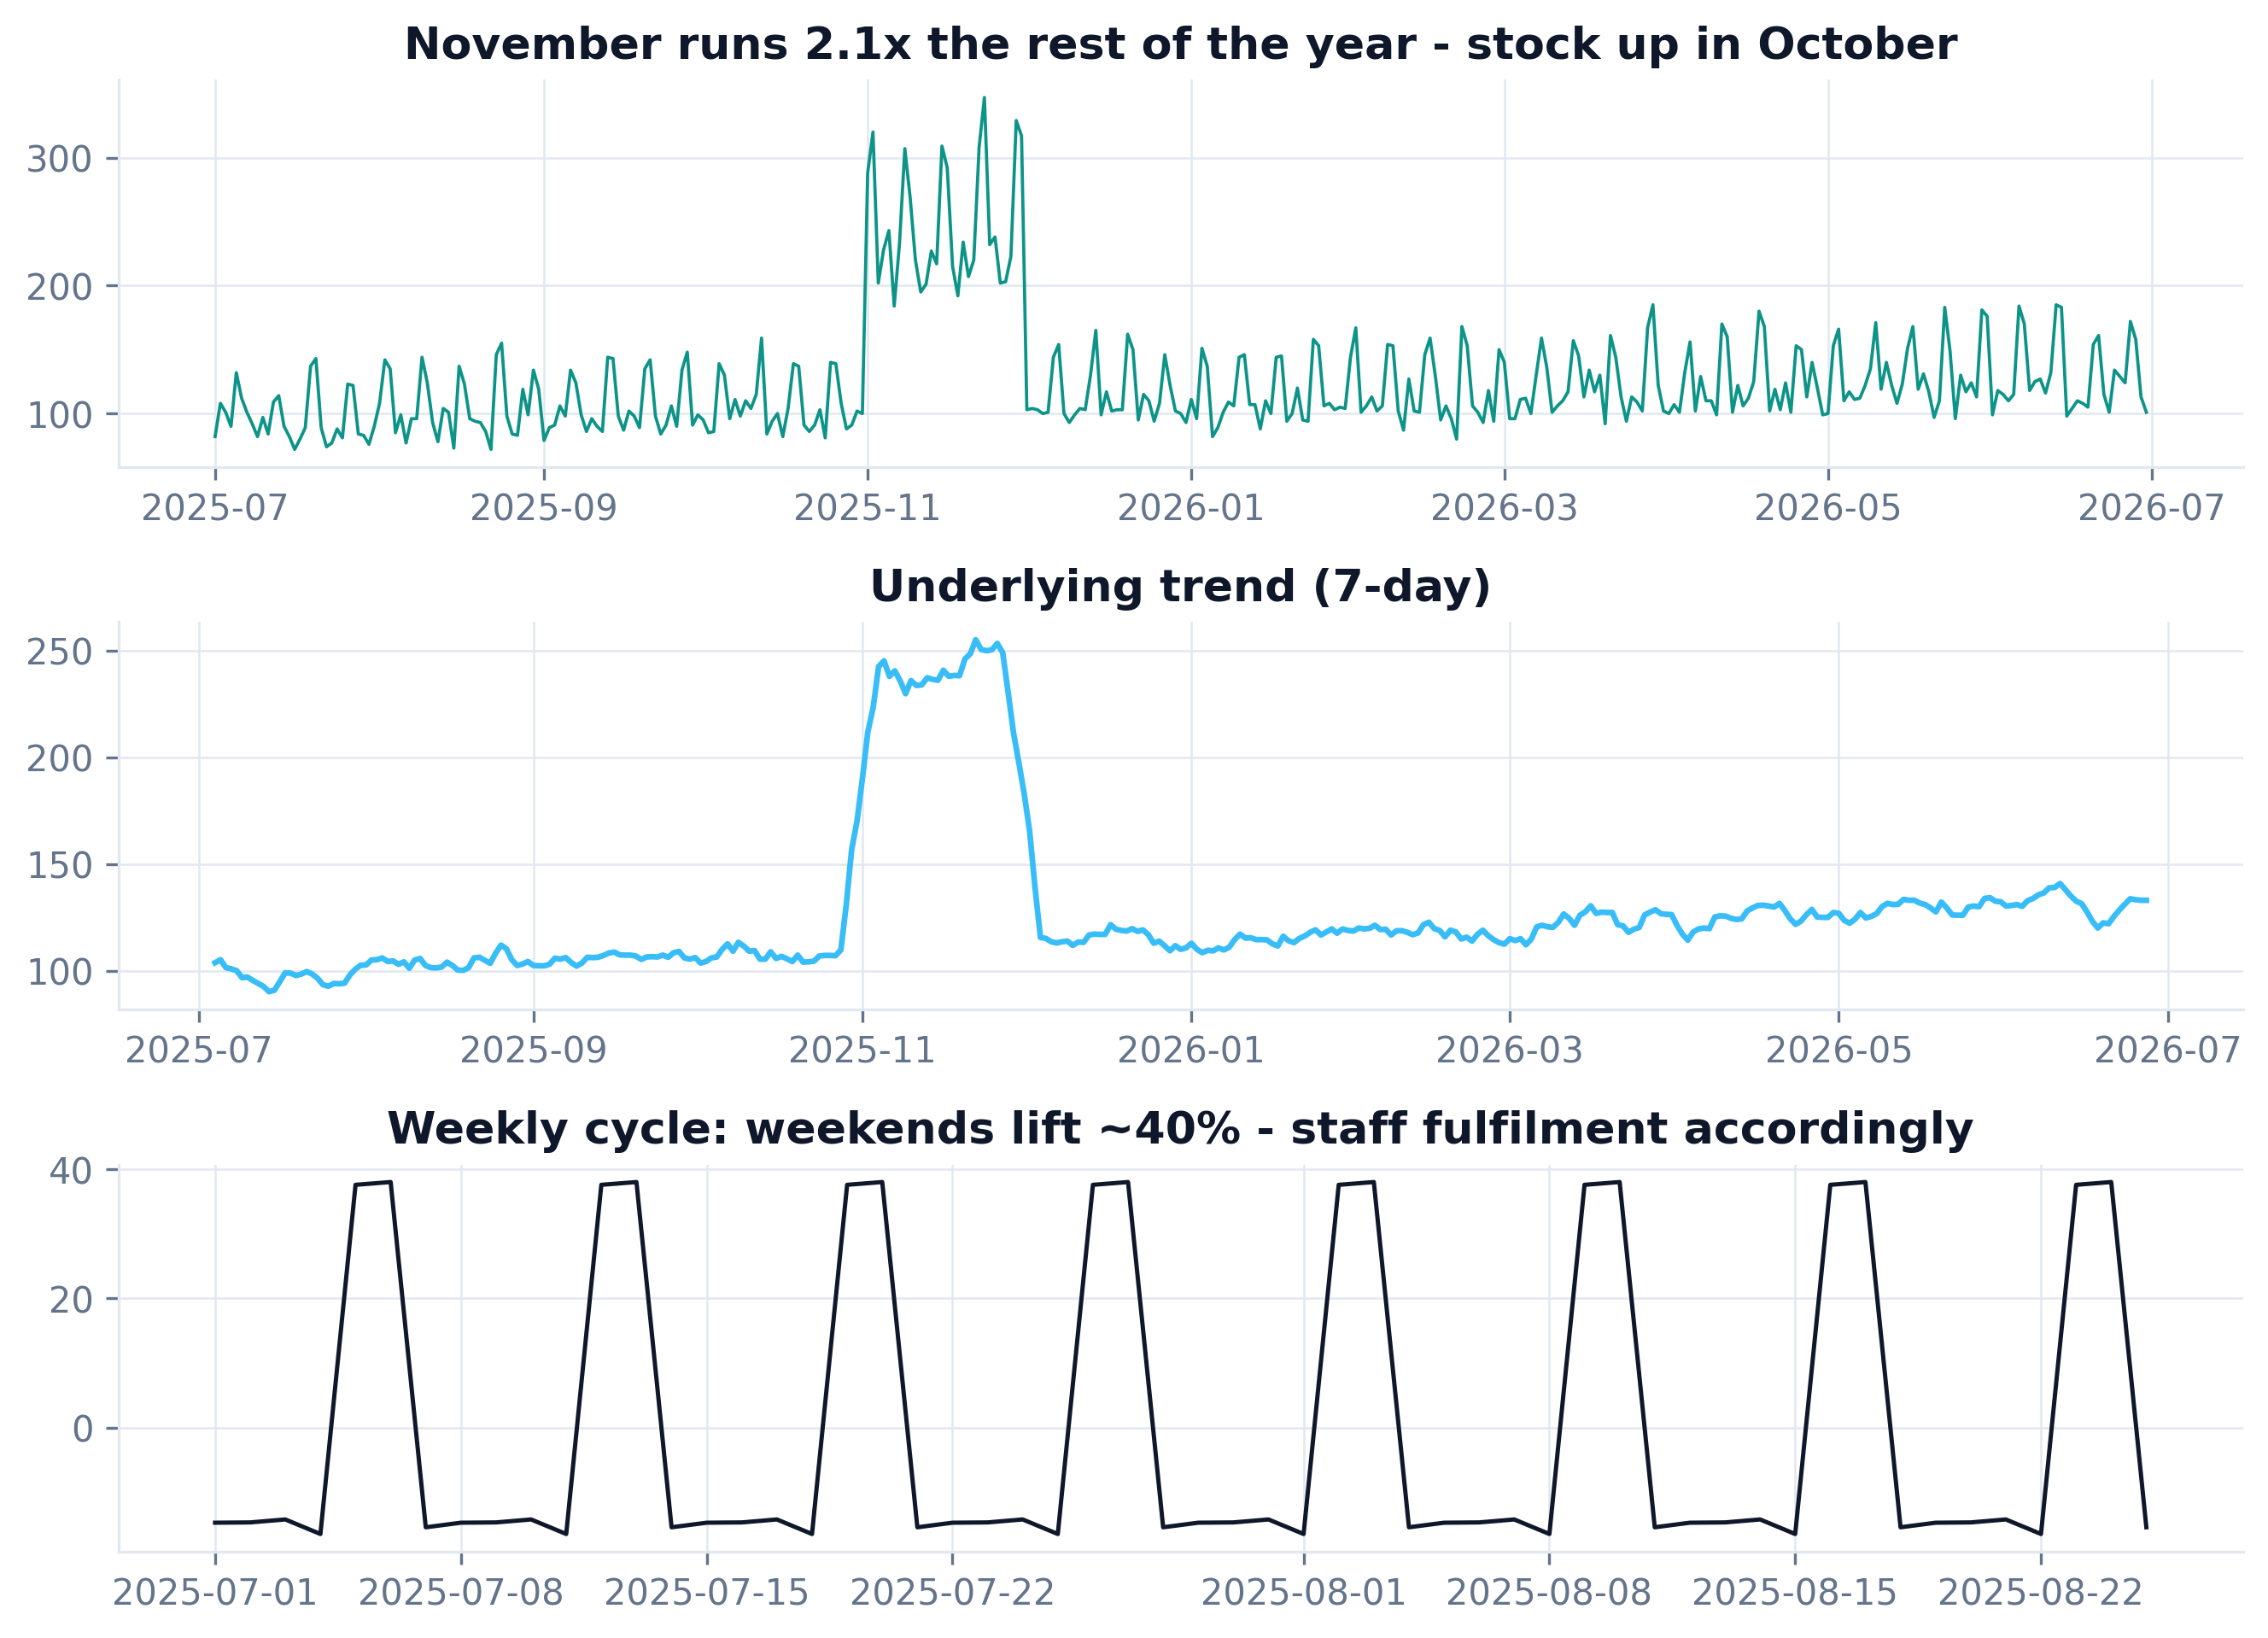
Three-panel seasonal decomposition: daily orders, 7-day trend, weekly cycle
Rhythm. November runs 2.1x baseline; weekends lift ~40%. Stock up in October, staff for weekends.
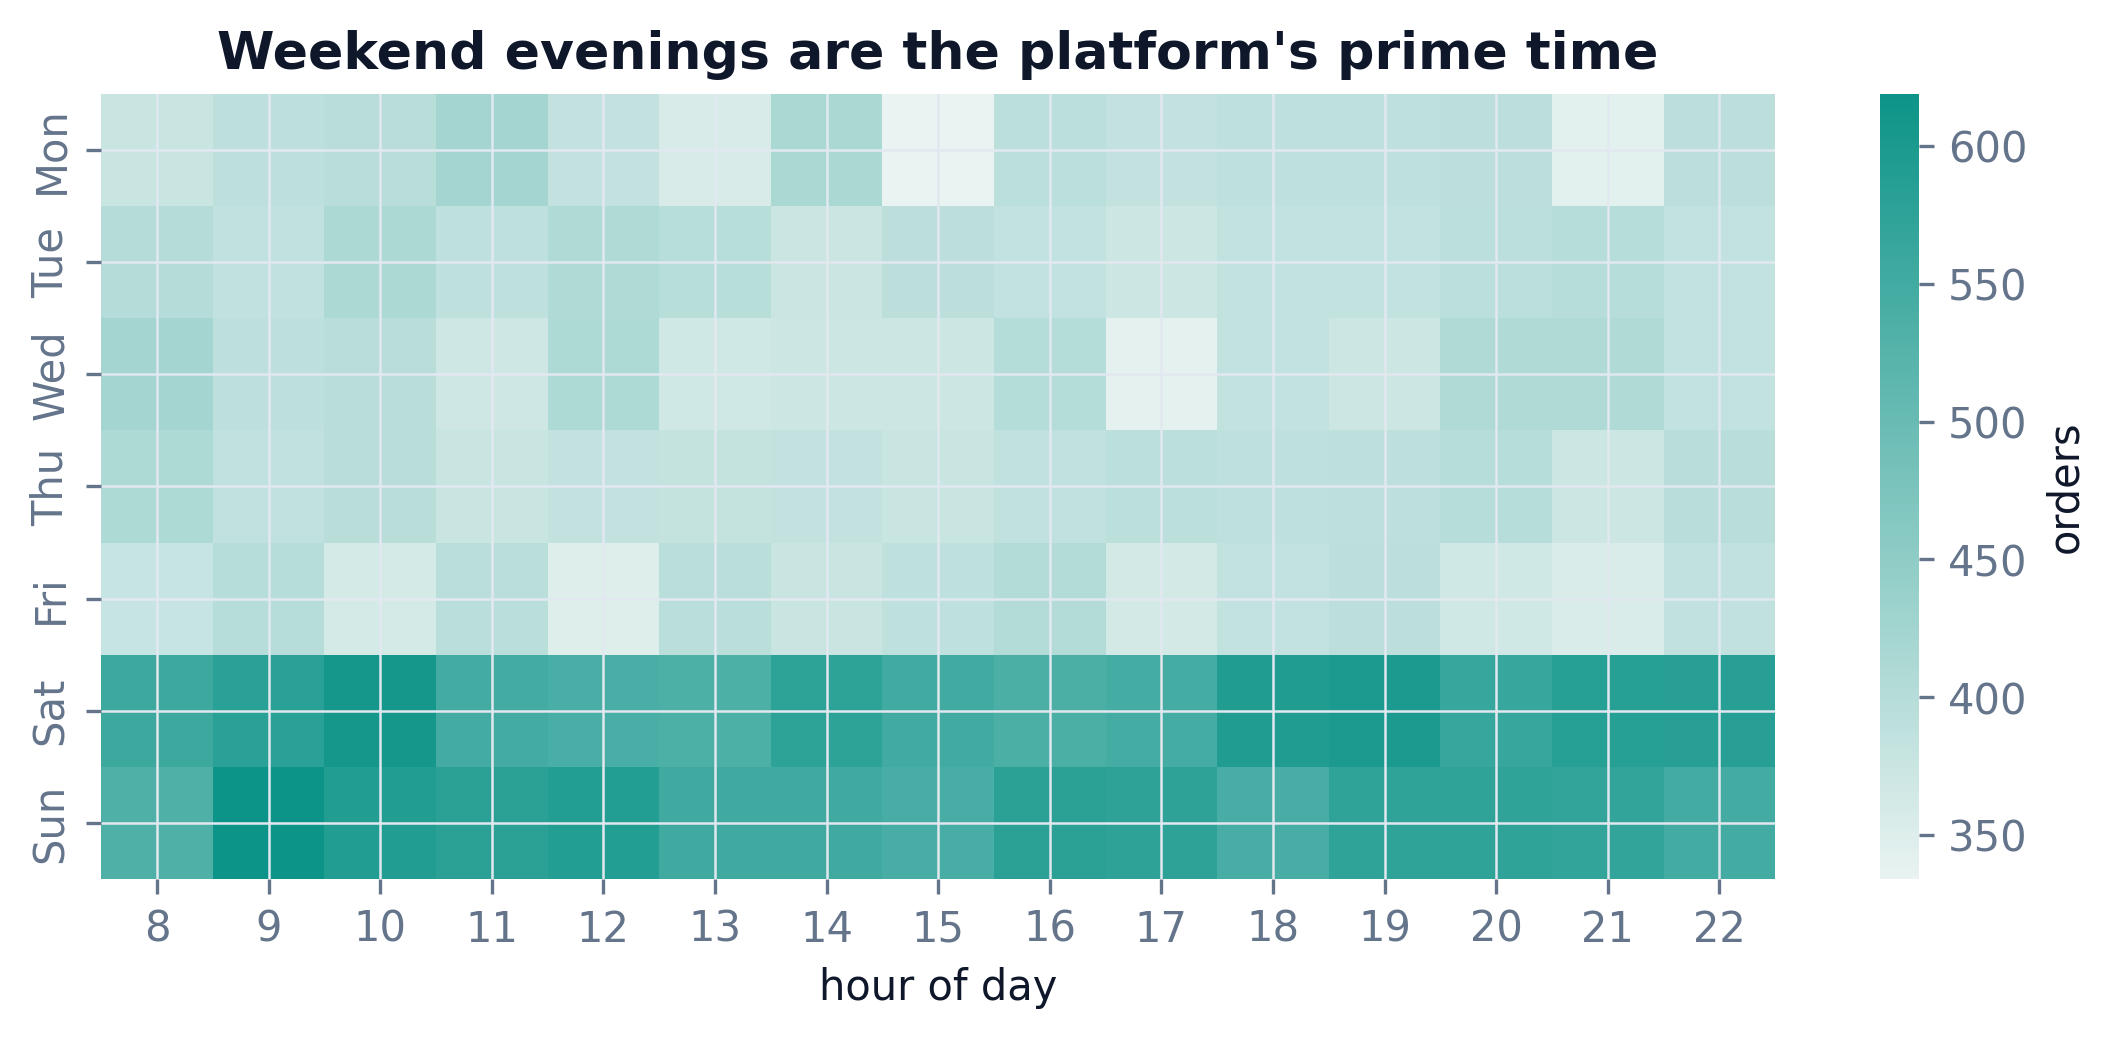
Heatmap of orders by day of week and hour, weekend evenings busiest
Prime time. Weekend evenings are the platform's busiest window.
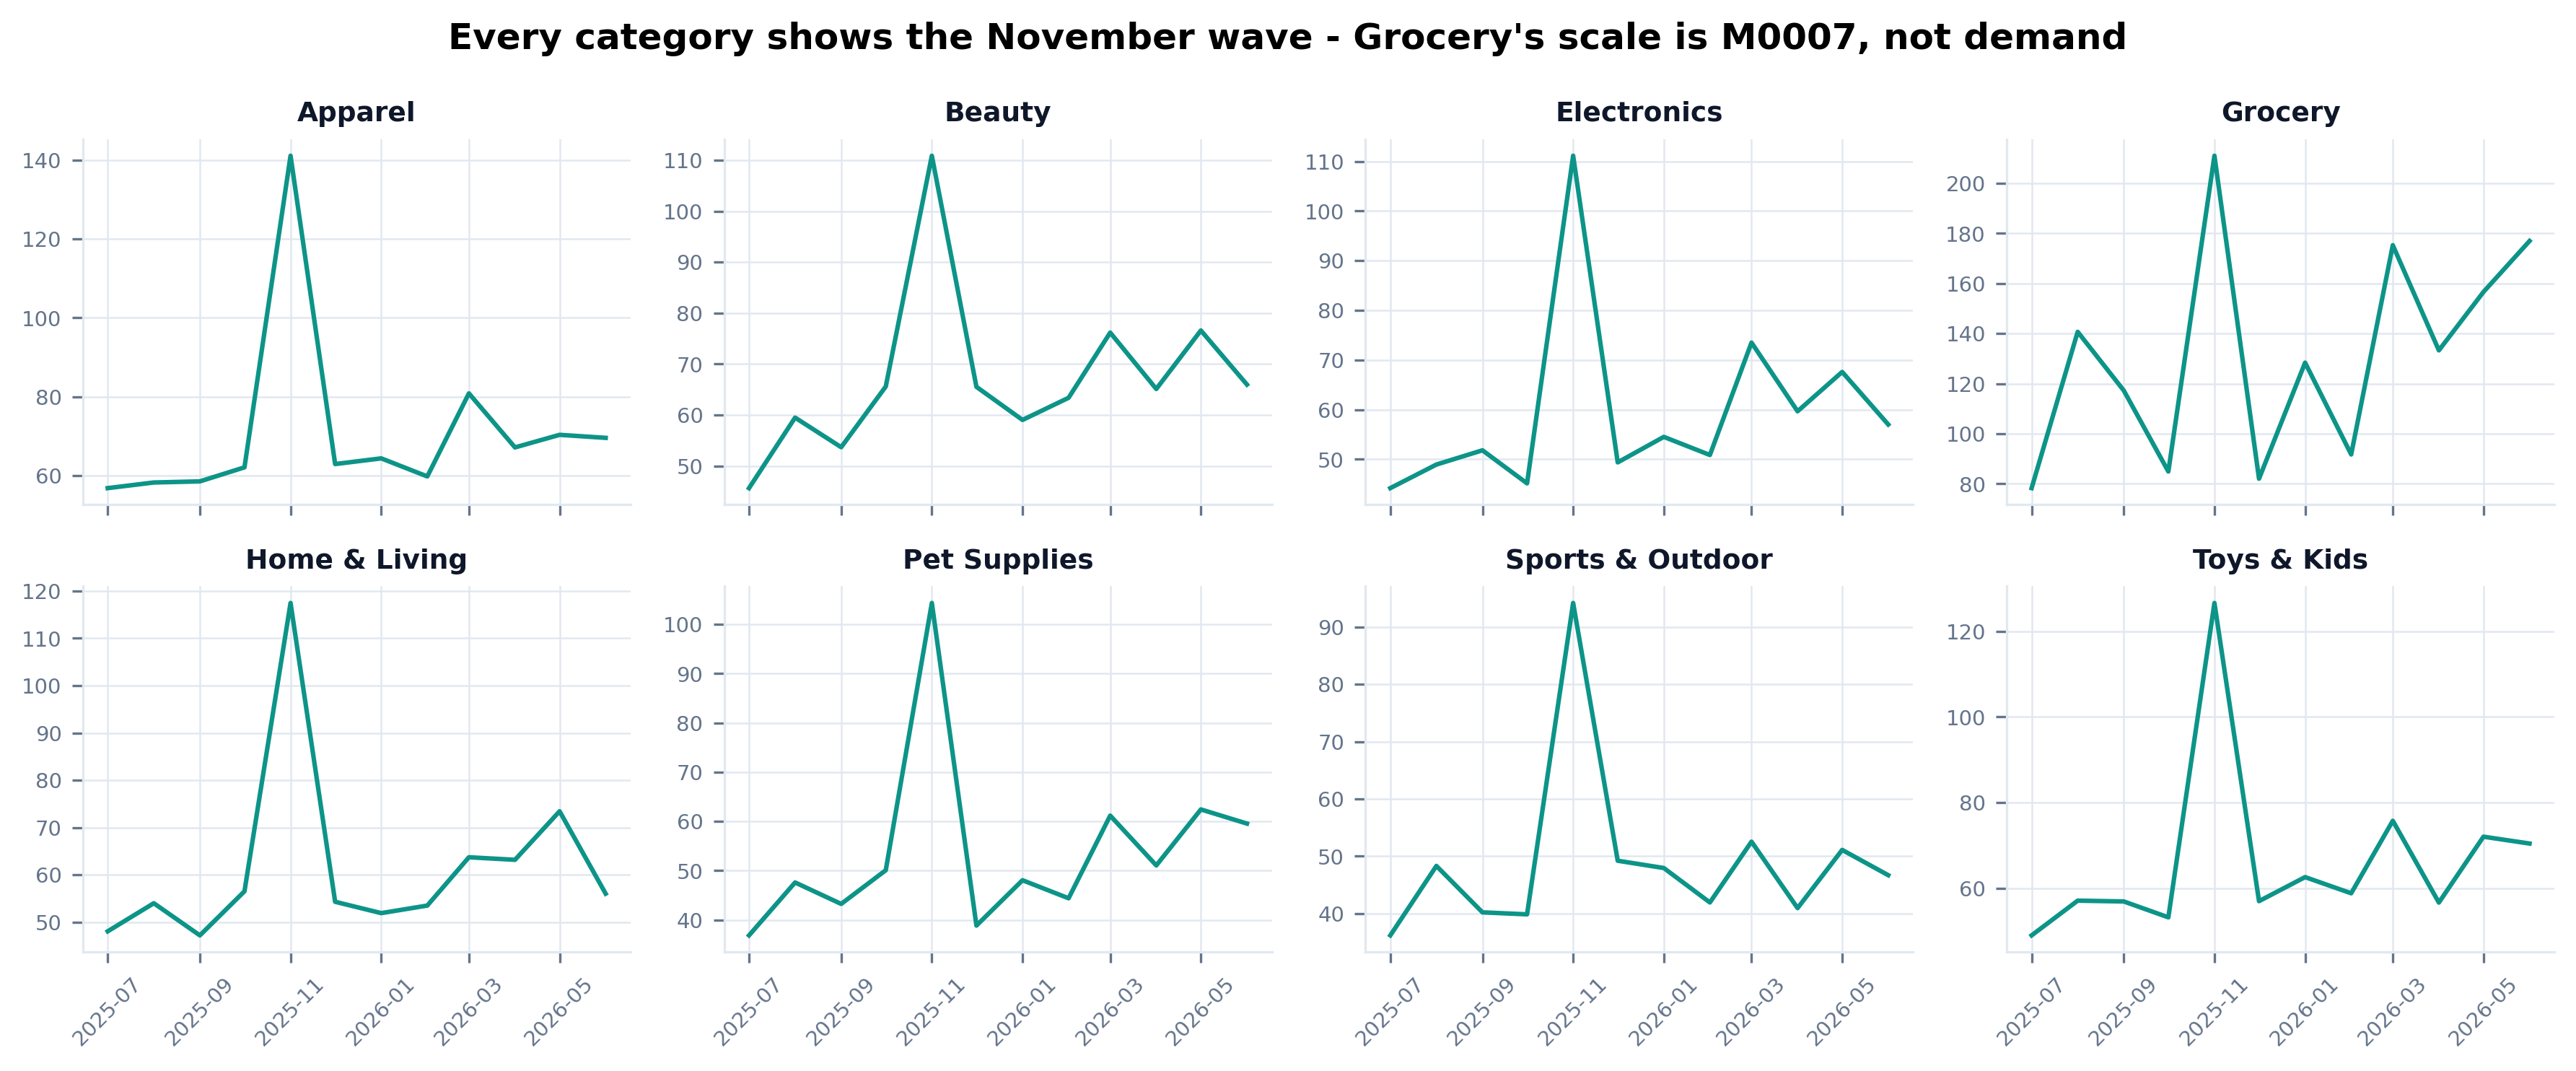
Small multiple line charts of monthly revenue for 8 categories
Category health. Every category shows the November wave - Grocery's scale is M0007, not real demand.
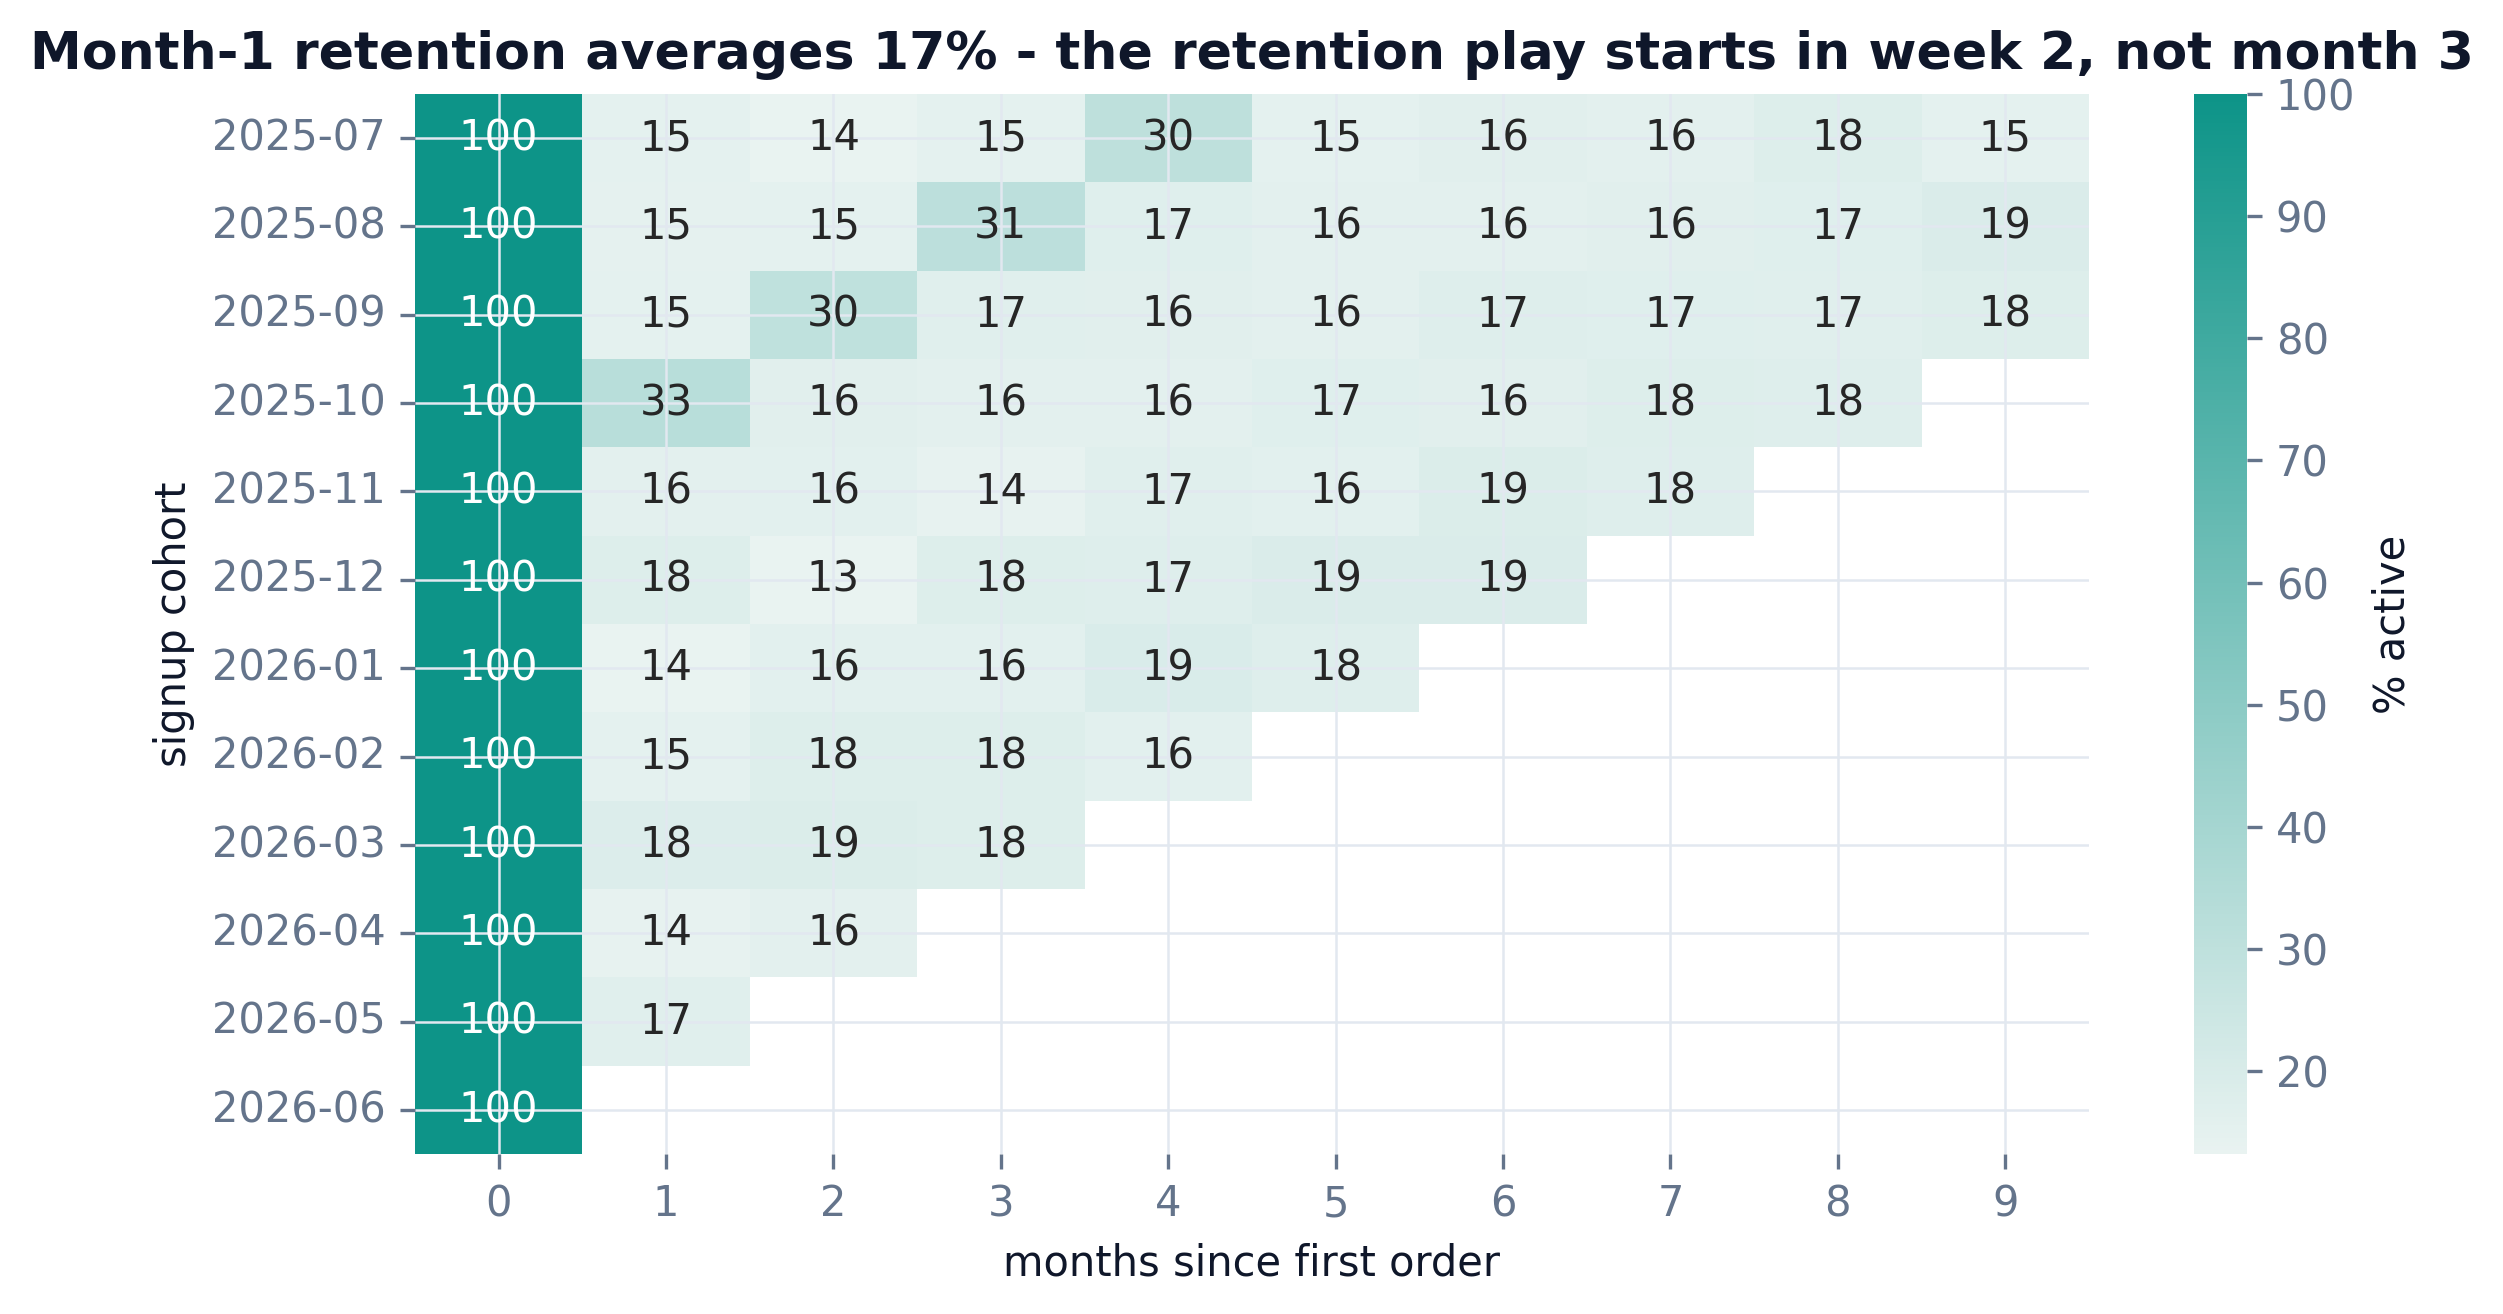
Cohort retention heatmap by signup month
Retention. Month-1 retention is where customers are lost - the retention play starts in week 2, not month 3.
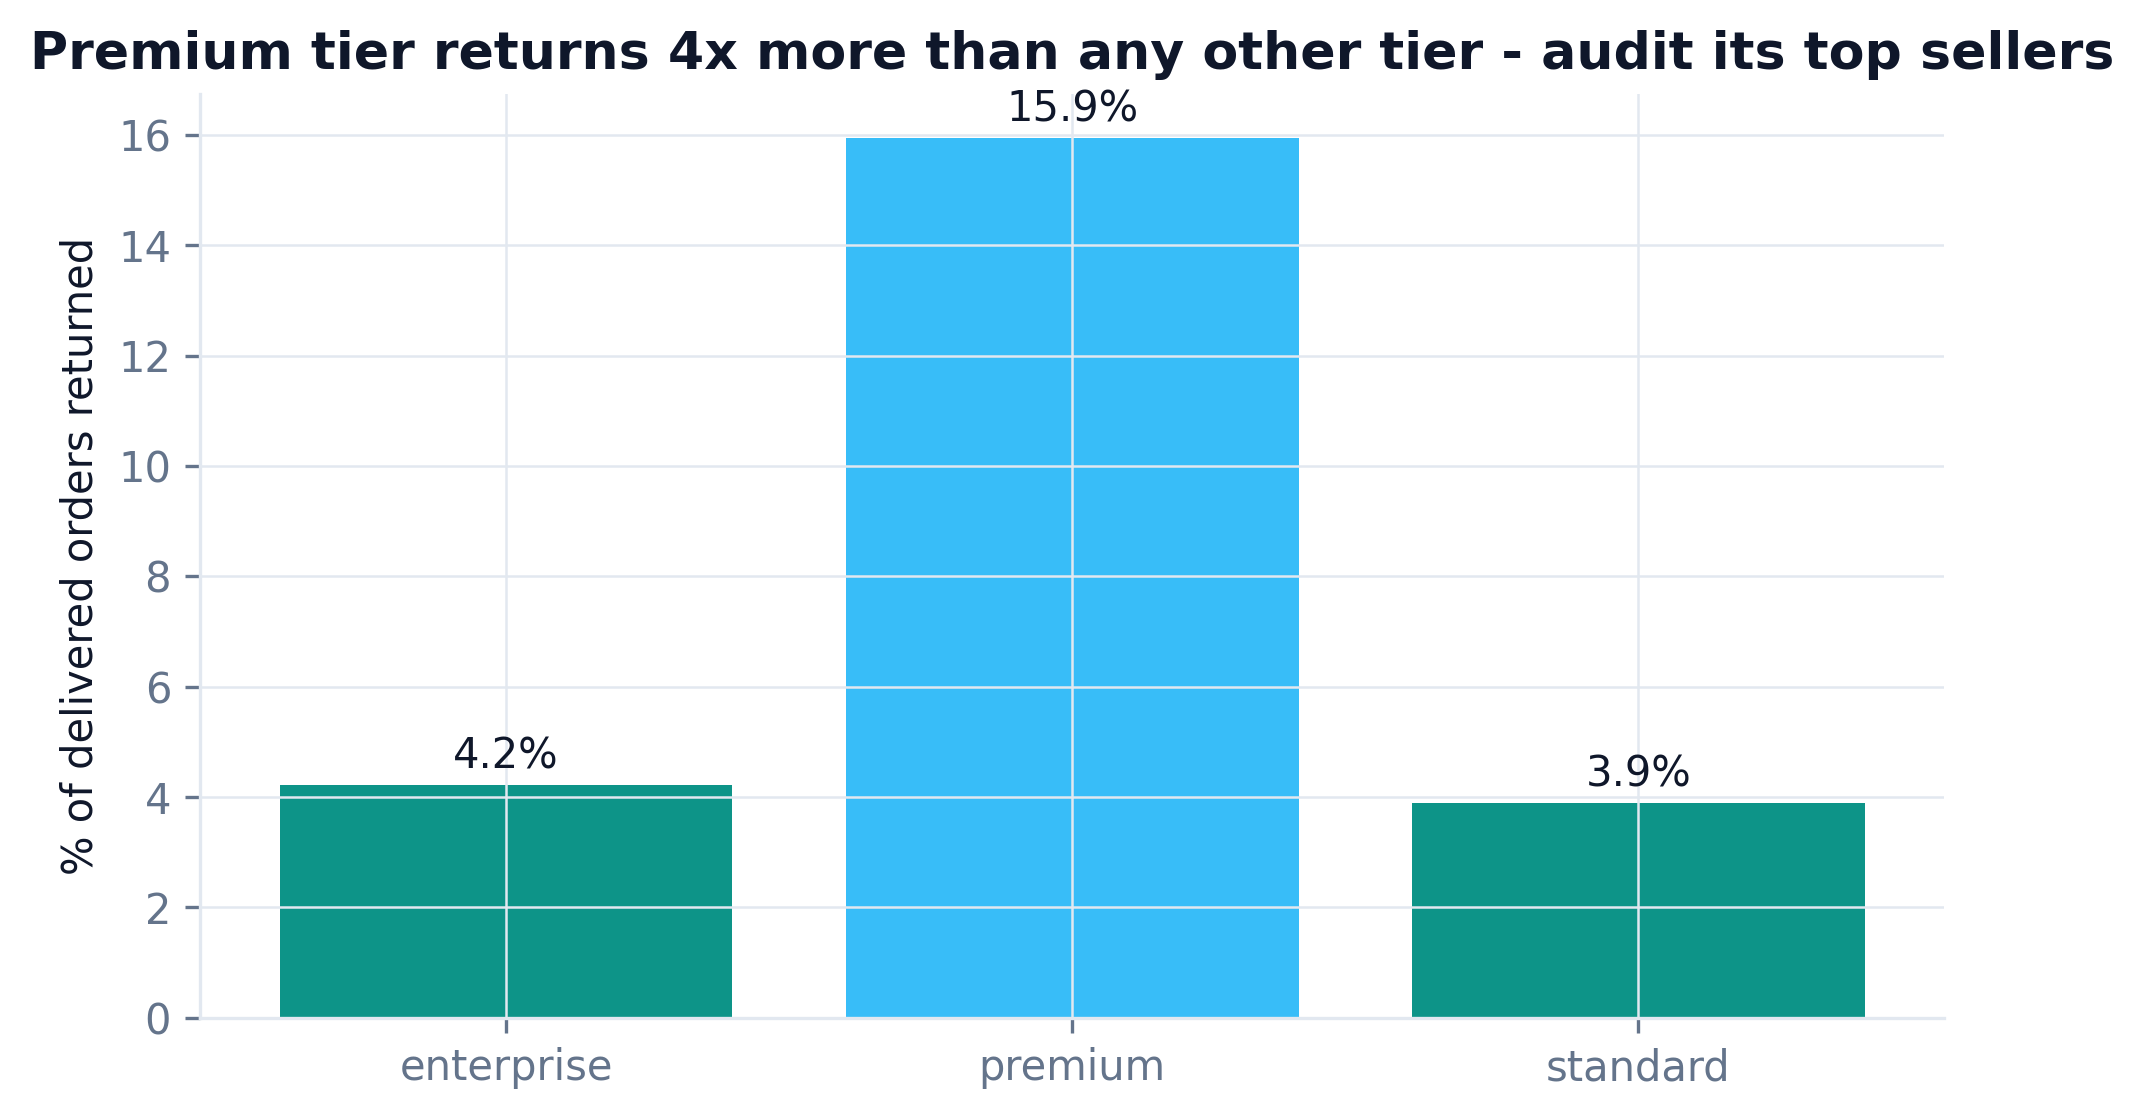
Bar chart: premium tier return rate 15.9 percent vs about 4 percent for other tiers
Hidden quality problem. Premium tier returns 15.9% of delivered orders - 4x any other tier. $212k comes back.
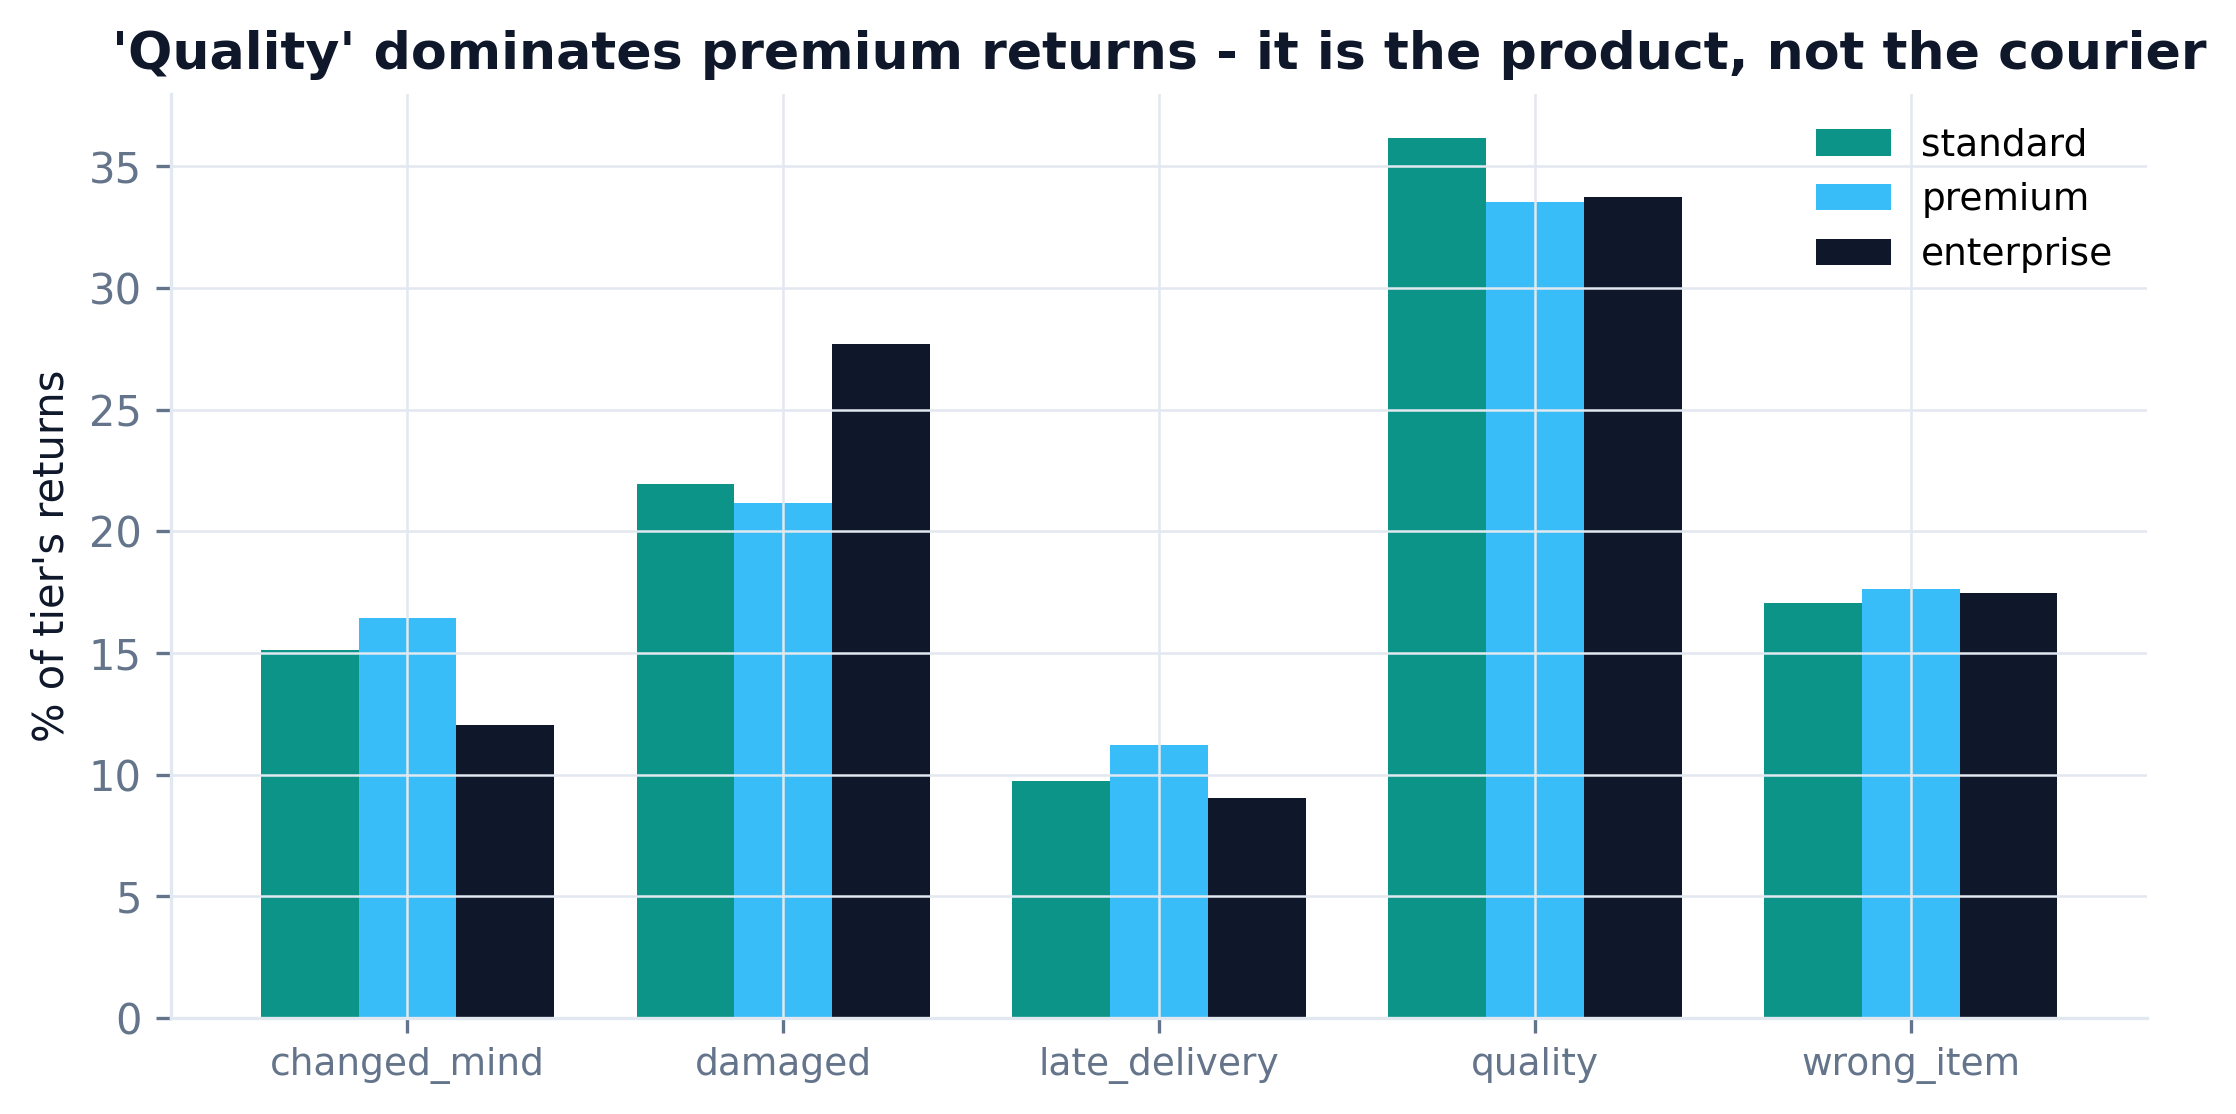
Grouped bar chart of return reasons by tier, quality dominates premium
Root cause. "Quality" dominates premium returns - it is the product, not the courier.
Planted quirkCaught by$ impactStatus
Missing payment methods (MNAR, affiliate)Missingness by channel$577,790 unattributable✓ caught
Outlier merchant M0007 (59x median)Box plot by tier + pareto12.7% of revenue✓ caught
600 duplicate order rowsDQ gate + duplicates timeline$154,559 inflation✓ caught
Weekend + November seasonalitySeasonal decomposition$1,016,712 Nov revenue✓ caught
Premium-tier return clusterReturn rate + reasons by tier$212,191 returned value✓ caught
Bonus (not planted): cancelled orders in revenueDQ gate$527,072 phantom value✓ caught
06
Step 6

Expert review - a check that changes the code

A panel of five senior reviewer agents - each with 10+ years in data, data insights, and business - tore into the first version of the analysis (eda_everrest_v1.py, kept in the repo). Every fix below was applied and the pipeline re-ran; the charts above are the post-review v2. Review that changes nothing is theater.

Senior Data Engineer
12 yrs · code & pipeline integrity

"v1 never deduped - 600 duplicate rows are inside every aggregate, and cancelled orders leak $527k into revenue. Gate the data before you touch it."

Fix applied: data-quality gate now runs before any aggregate; dupes and cancelled orders quantified, then excluded.
Analytics Methodology Lead
10 yrs · data quality & rigor

"Overall missingness (7.8%) looks benign and hides the story. Break missingness down by segment or you will never see missing-not-at-random."

Fix applied: added missingness-by-channel chart - exposed the 55% affiliate null rate.
Data Insights Lead
11 yrs · decision framing

"Half of v1's titles were techniques: 'Correlations', 'Order value distribution'. A chart that doesn't change a decision is decoration."

Fix applied: every title rewritten as a finding; corr heatmap (no action) replaced with return-reasons chart; log scale added; M0007 named on the chart.
Commercial / Business Lead
14 yrs · impact & actionability

"Nothing in v1 was quantified. Executives don't rank findings by p-value, they rank by money."

Fix applied: every finding carries a $ figure; findings.md ranks all six by impact.
Data QA & Reproducibility
10 yrs · trust & recall

"Prove it reproduces. Re-run from a clean checkout and confirm the analysis recovers every planted quirk, not just the easy ones."

Fix applied: fixed seed verified byte-identical on a clean run; all 5 planted quirks confirmed recovered, plus 1 unplanned finding.
before → after ↗ · the aggregate that lied
# v1 (before): revenue computed on raw orders - dupes + cancelled included
rev = orders.groupby("merchant_id").order_value.sum()

# v2 (after): DQ gate first - $681k of phantom value removed
orders = orders_raw.drop_duplicates()                  # -$154,559
rev_orders = orders[orders.status != "cancelled"]     # -$527,072
rev = rev_orders.groupby("merchant_id").order_value.sum()

Run this skill on your own schema

Install once, then hand Claude your tables and business context - the same 6 steps run on your data (step 2 is skipped when real data exists).

terminal
/plugin marketplace add phoebefu6/phoebe-data-skills
/plugin install how-to-eda@phoebe-data-skills