Skill walkthrough

how-to-RFM-using-claude-python

One CRM budget decision, one retail platform, six steps. Segment all 20,000 Everrest customers by Recency, Frequency, Monetary - then rank where the retention money should go. Every chart from a real run, seed 42.

Case: Everrest · B2B2C retail platform seed = 42 pandas · matplotlib classic 5×5 RFM · 11 segments 12 chart types 6 findings, $-ranked
01
Step 1

Input - schema + business context

RFM needs only transaction history. From the Everrest platform we take three tables - customers, orders, order_items - plus one line of context: the CRM team has a fixed Q3 retention budget and wants to know where to spend it. Recency, Frequency and Monetary are all derivable from these three tables alone.

customers 20,000 rows
  • customer_id · pk
  • signup_date · date
  • channel_id · acquisition channel
  • region · SEA market
orders 107,417 rows
  • order_id · pk
  • customer_id · fk
  • order_ts · timestamp → Recency
  • status · delivered / returned
order_items 191,762 rows
  • order_id · fk
  • qty · unit_price · discount
  • → net = Monetary
the 3 RFM signals
  • Recency · days since last order
  • Frequency · delivered order count
  • Monetary · total net delivered spend
02
Step 2

Generate sample data - customers with real lifecycles

A dedicated seeded generator draws every customer from a lifecycle archetype, so an RFM segmentation has real structure to recover. Five patterns are planted on purpose and documented in the generator docstring - Step 5 grades whether the analysis found each one.

generate_everrest_rfm.py ↗ · excerpt (full script on GitHub)
rng = np.random.default_rng(42)

# each customer drawn into a lifecycle archetype with its own
# frequency / recency / spend ranges
ARCHETYPES = {
    #                  share  freq     recency   spend
    "champion":       (0.05, (12,30), (1,30),  (90,260)),
    "cant_lose_them": (0.03, (8,20),  (150,330),(120,320)),  # whale lapsers
    "hibernating":    (0.14, (2,4),   (200,330),(30,80)),
    # ... 10 archetypes total, seed 42
}
🐋 Whale concentrationA small champion + loyal core drives most of the monetary value
⏳ Can't-lose-themHighest past spenders who have gone quiet - win-back gold
🎯 Affiliate one-and-doneSingle low-value order, never returned - over-indexed on affiliate
🌊 Nov signup cohortPromo-acquired customers who never reactivated
↩ Returns-heavy segmentHigh order count but net value dragged low by returns
03
Step 3

Objective - a budget decision, not a scoring exercise

RFM is a means, not the goal. The goal is a defensible answer to where the Q3 retention budget goes. Every chart in Step 5 serves one of these sub-questions.

Which Everrest customers should the CRM team spend its Q3 retention budget on - and which are quietly the most valuable?
  • How concentrated is customer value - is Everrest whale-dependent?
  • Which high-value customers are lapsing right now (win them back before they're gone)?
  • Which acquisition channel floods us with one-and-done, low-value buyers?
  • How big and how valuable is each actionable segment?
  • Where does the next dollar of retention budget earn the most?
04
Step 4

Find-skills - Claude assembles its toolbox

The tools and skills that serve an RFM segmentation, picked before any code.

Technique

pandas qcut scoring

Quintile R/F/M scores 1-5 - the backbone of classic RFM. Rank-break ties on frequency.

Reference

11-segment standard map

Industry-standard R×FM grid → Champions, Loyal, At Risk, Can't Lose Them, Hibernating, Lost...

Claude skill

dataviz discipline

Treemap for segment size, bubble map for the budget call - form follows the relationship.

Claude skill

schema-to-insights playbook

Rank each segment by dollar opportunity, tie every finding to a budget action.

05
Step 5

Code + charts - the real run

Score R/F/M on delivered-only revenue → map to 11 named segments → size and value each → recommend the budget split. 12 chart types, every PNG rendered at 300 DPI from the actual run. Grab the code - one click, copy, run.

rfm_everrest_v2.py ↗ · scoring + segment map (excerpt)
# DQ gate: score on DELIVERED revenue only - returns are not monetary
deliv = orders[orders.status == "delivered"]
rfm = deliv.groupby("customer_id").agg(
    recency=("order_ts", lambda s: (REF_DATE - s.max()).days),
    frequency=("order_id", "count"),
    monetary=("order_value", "sum"))

rfm["R"] = pd.qcut(rfm.recency, 5, labels=[5,4,3,2,1])
# F on rank so ties don't break qcut; M by spend quintile
# then map (R, FM) -> 11 named segments, value-critical first
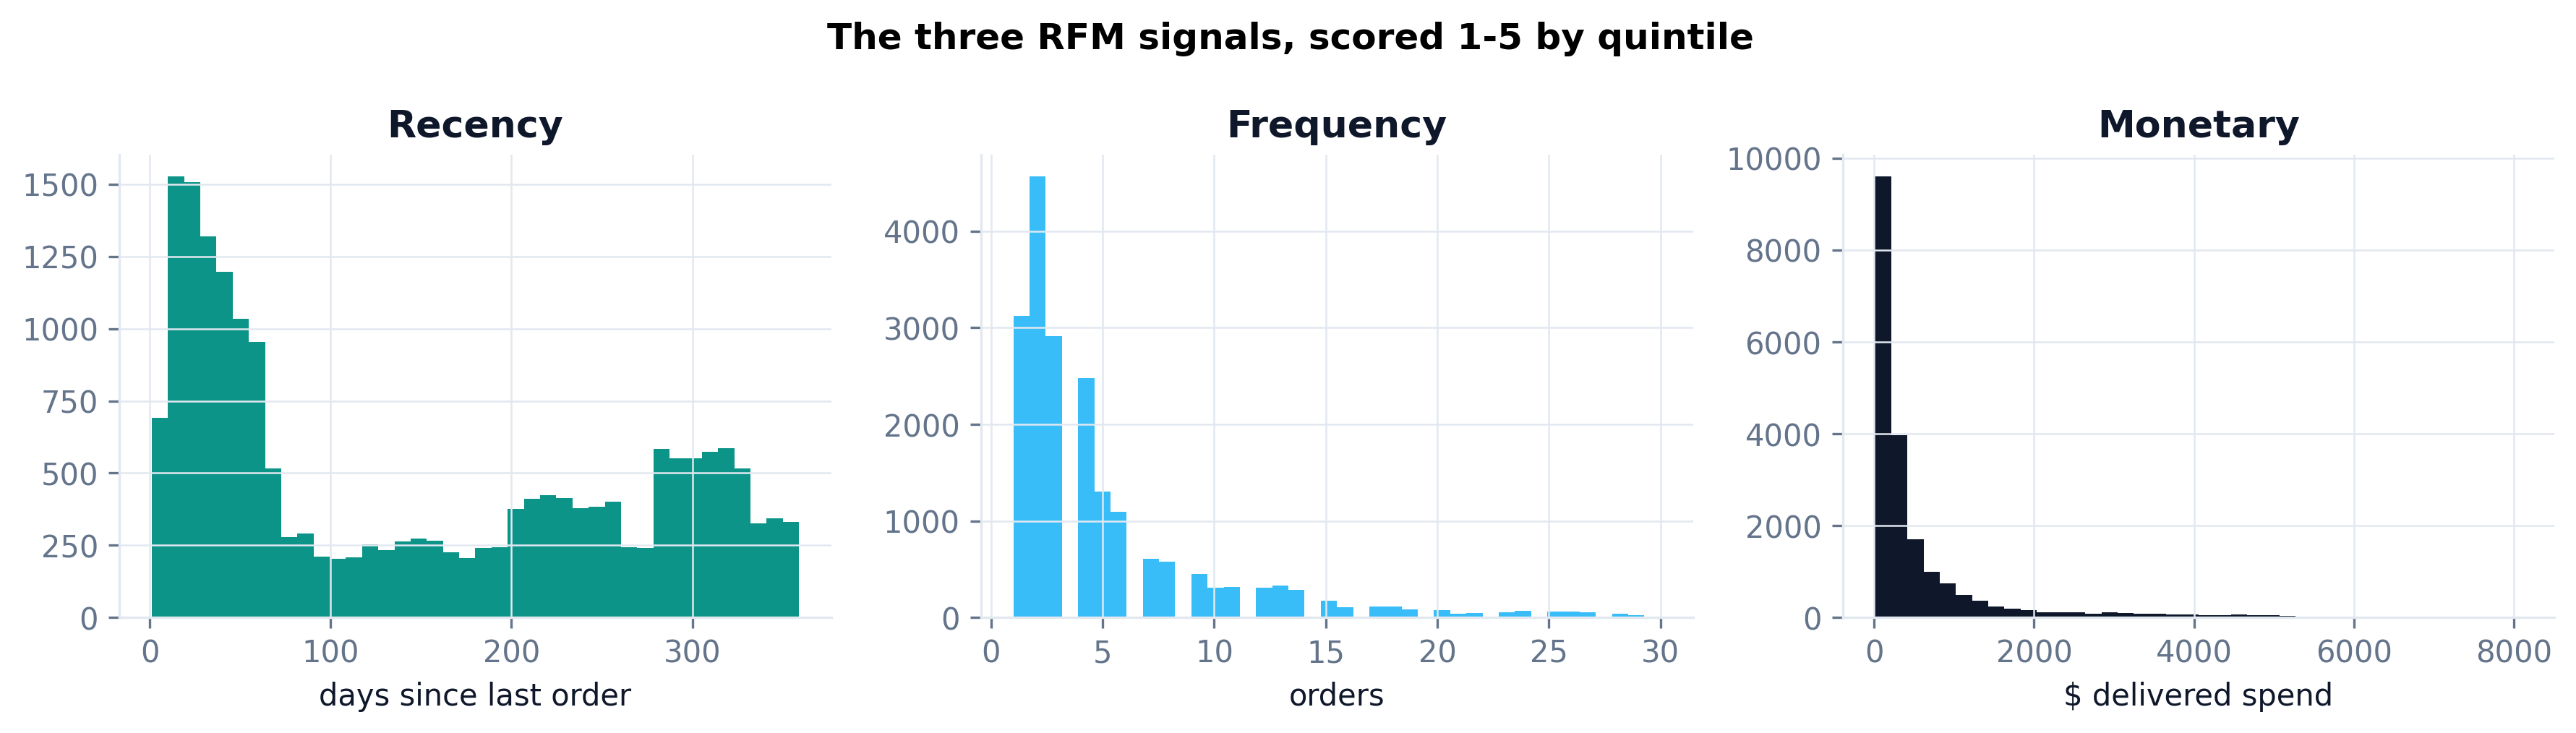
Three histograms: recency, frequency, monetary distributions
The three signals. Recency, frequency and monetary, each scored 1-5 by quintile.
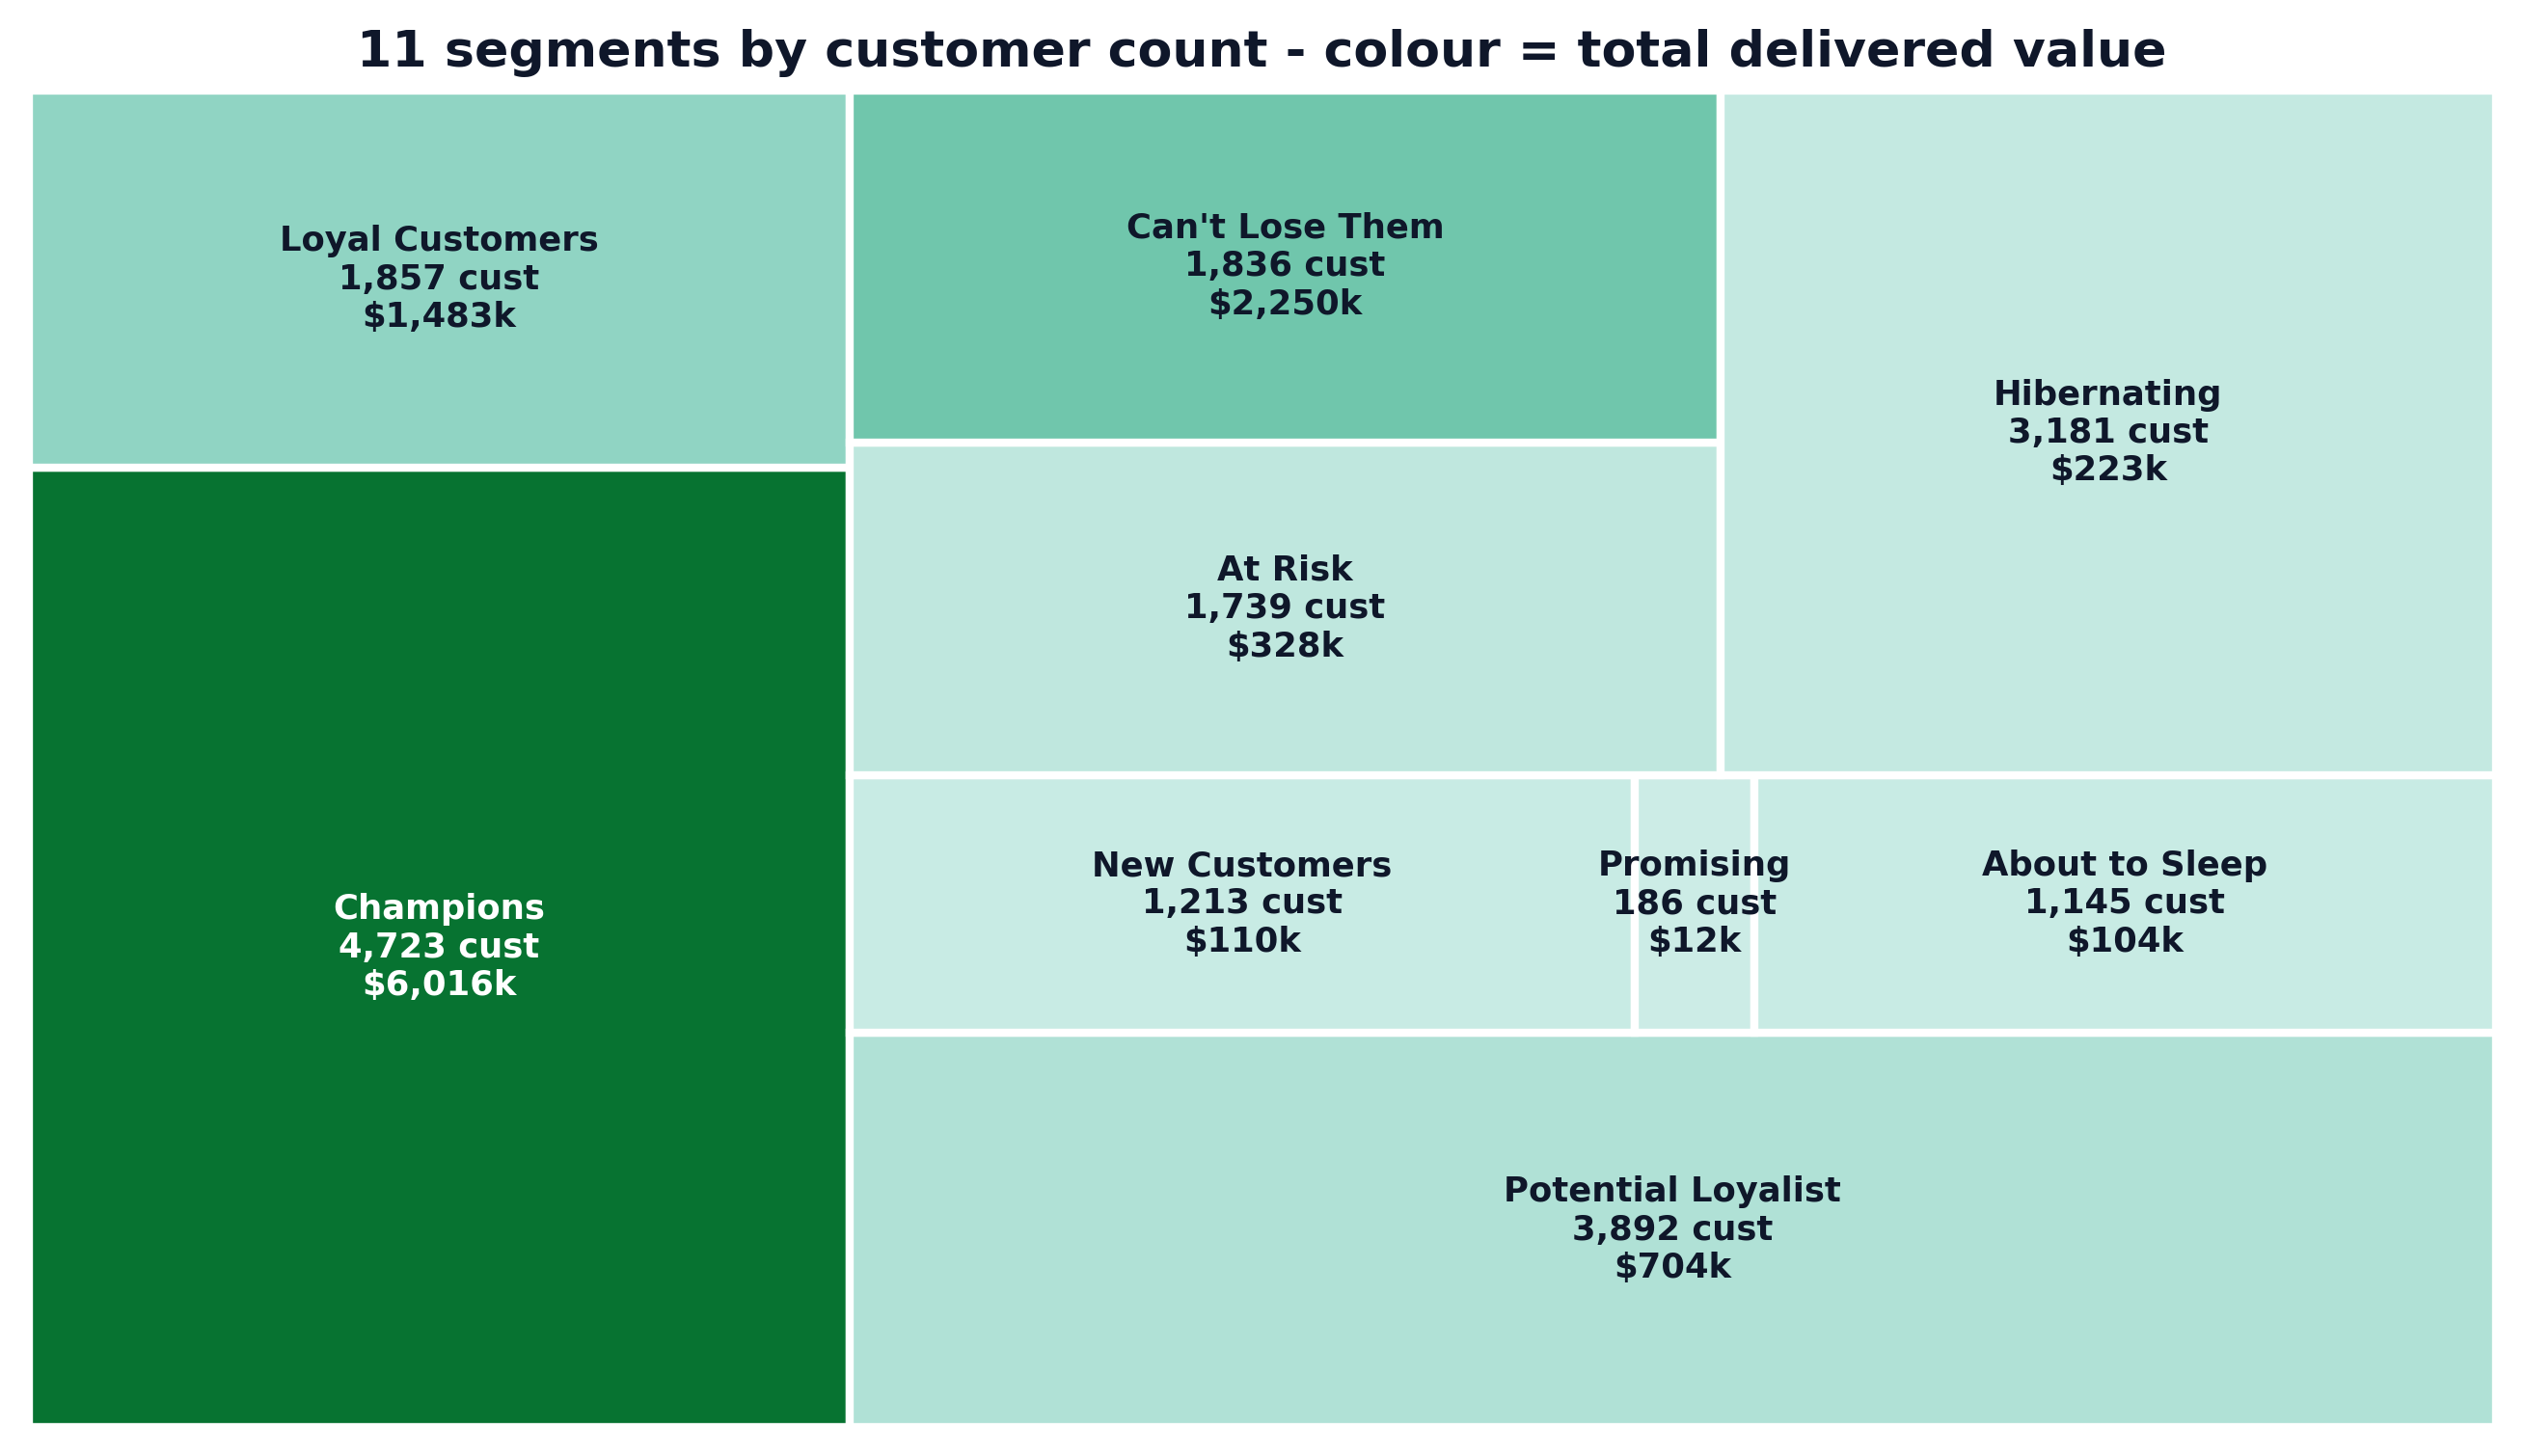
Treemap of 11 RFM segments sized by customers, coloured by total value
The 11 segments. Champions are the dark block - most customers AND most value. Can't-Lose-Them punches far above its size.
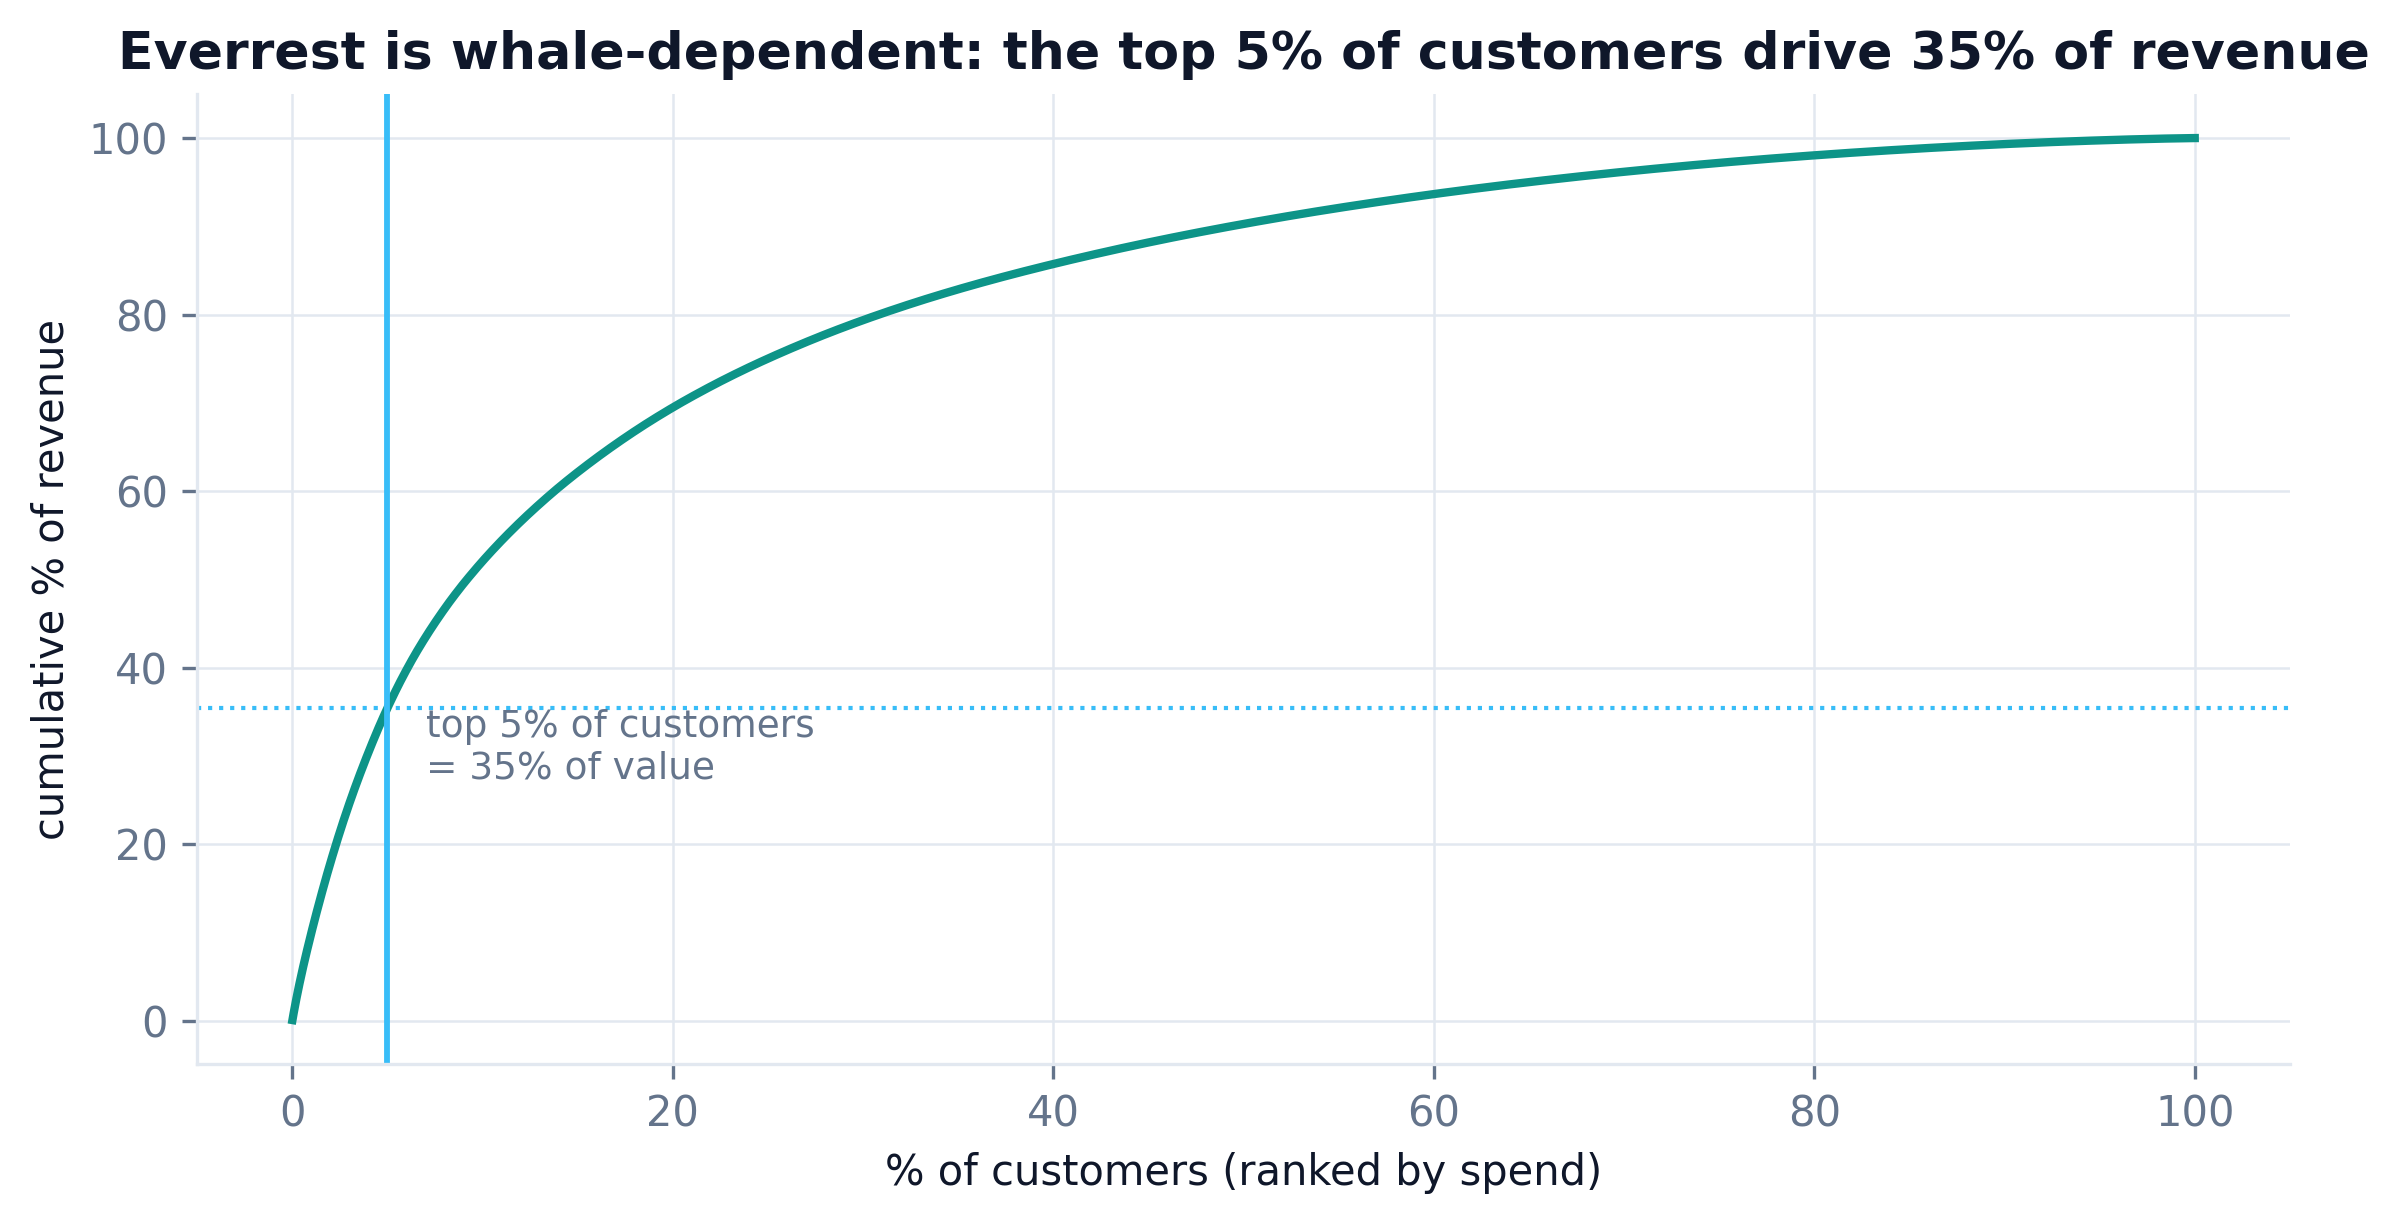
Monetary pareto: top 5 percent of customers drive 35 percent of revenue
Whale check. The top 5% of customers drive 35% of revenue - Everrest is whale-dependent.
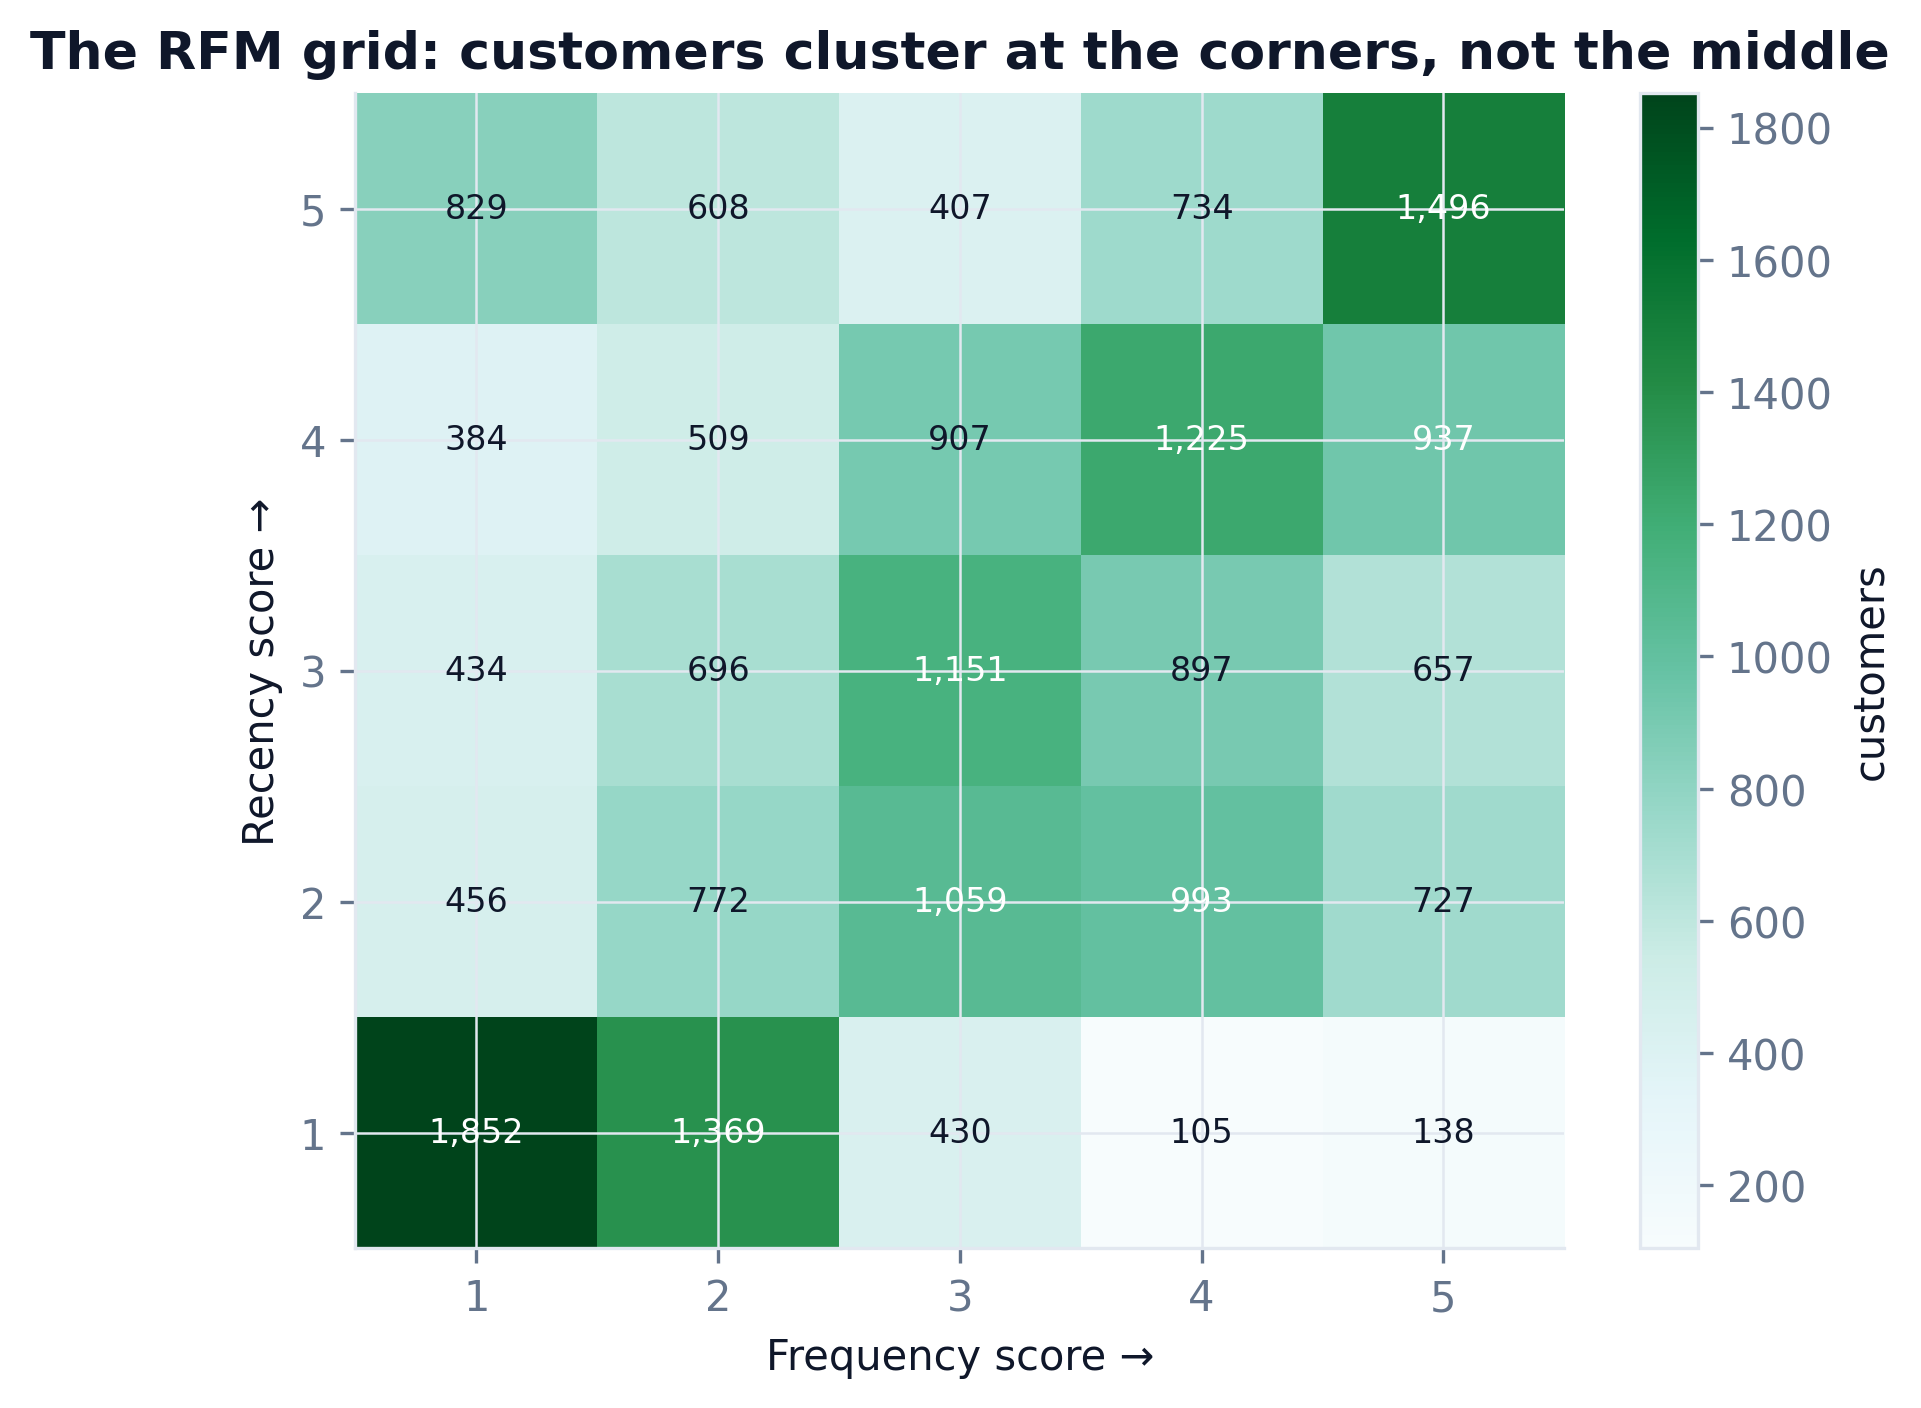
Recency by Frequency score grid heatmap of customer counts
The RFM grid. Customers cluster at the corners - the actionable segments live in the extremes.
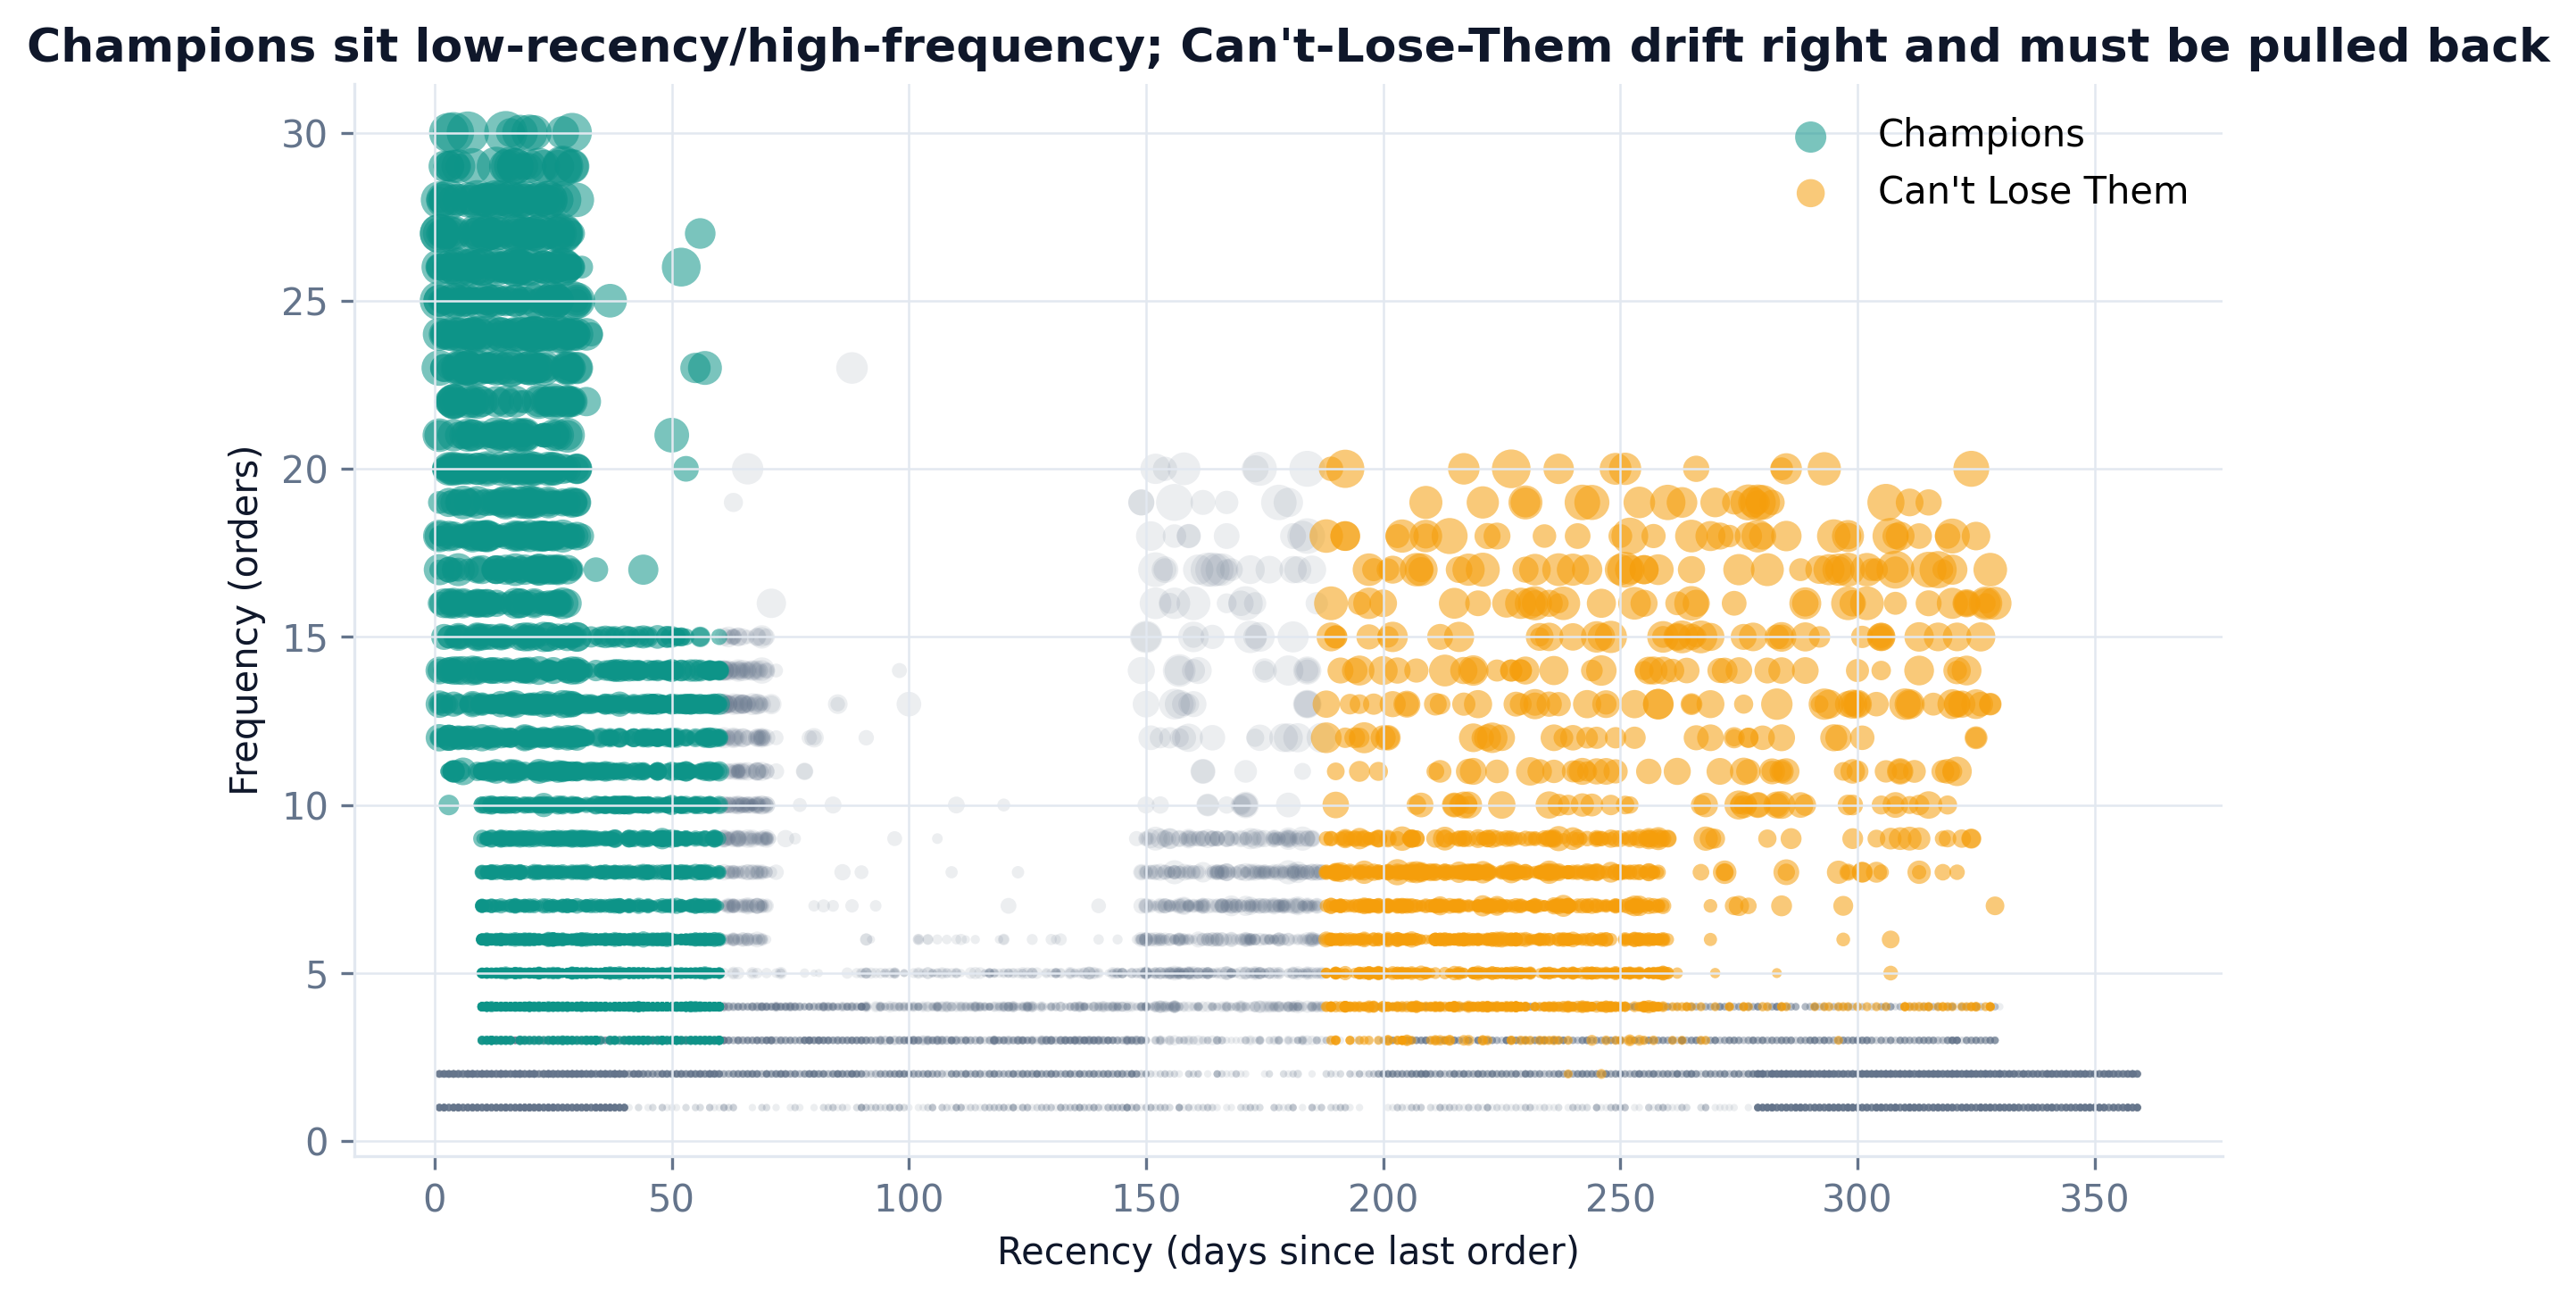
Recency vs frequency scatter, Champions and Can't Lose Them highlighted
Where segments live. Champions cluster low-recency/high-frequency; Can't-Lose-Them drift right and must be pulled back.
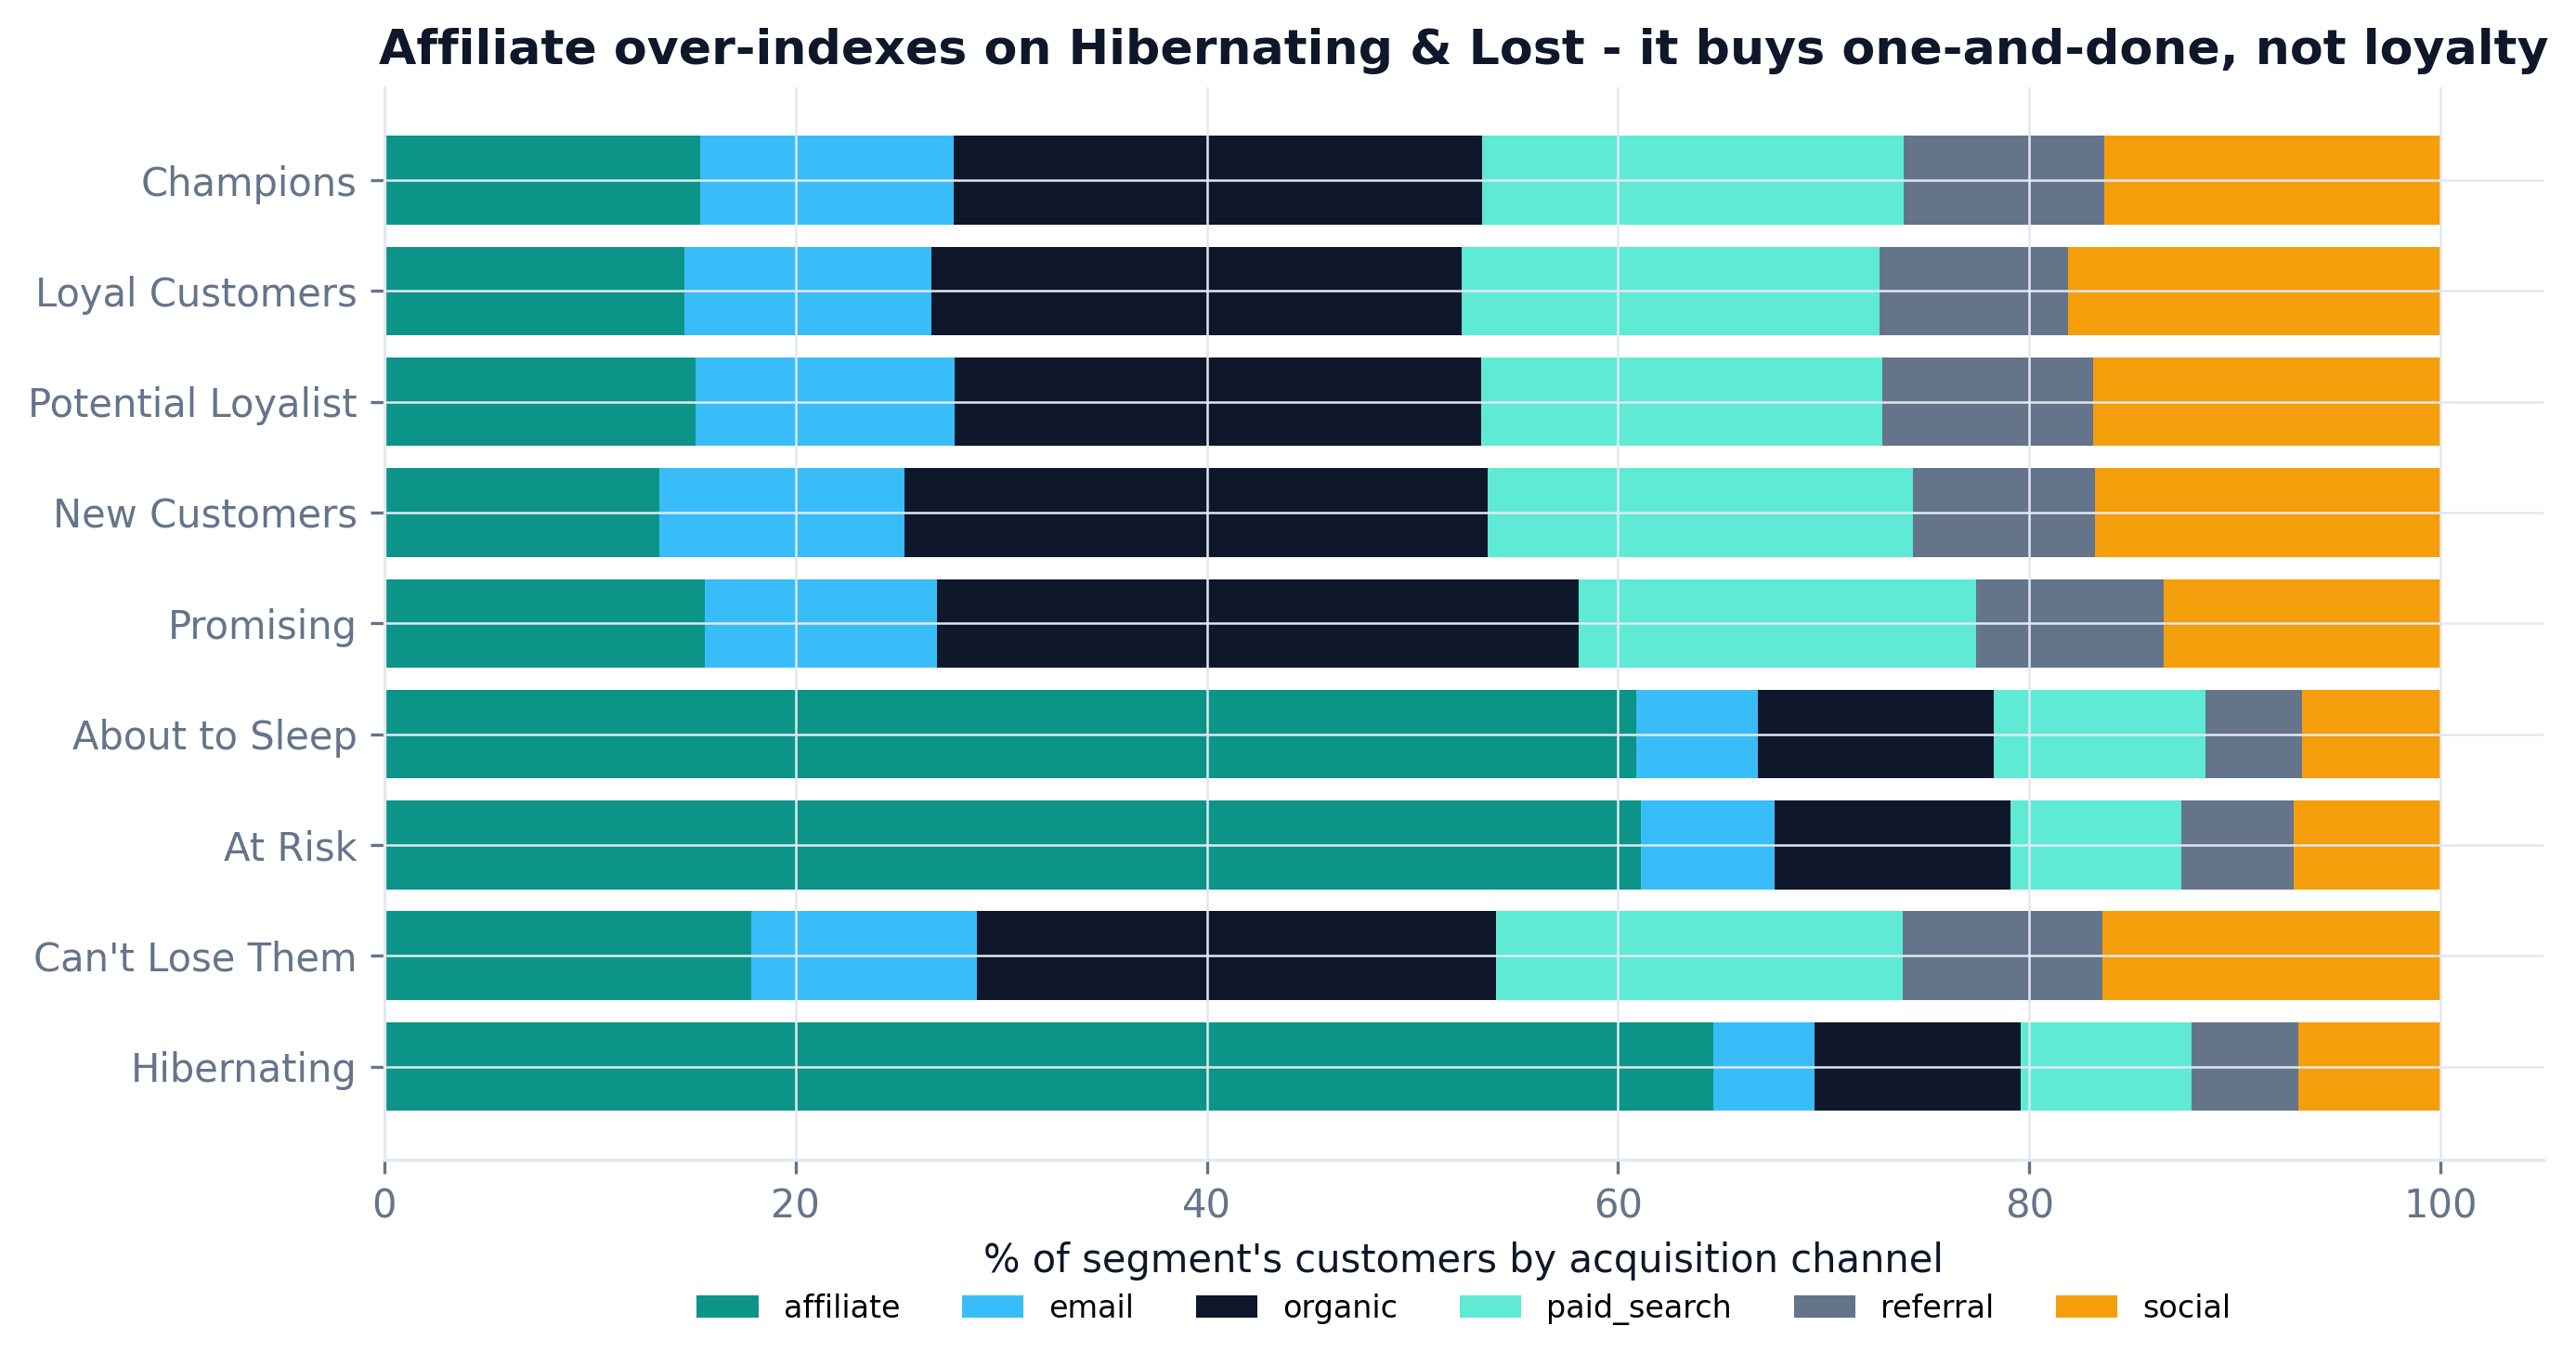
Stacked bar of segment composition by acquisition channel, affiliate over-indexed on lost
Affiliate one-and-done. Affiliate over-indexes on Hibernating & Lost - it buys one-and-done, not loyalty.
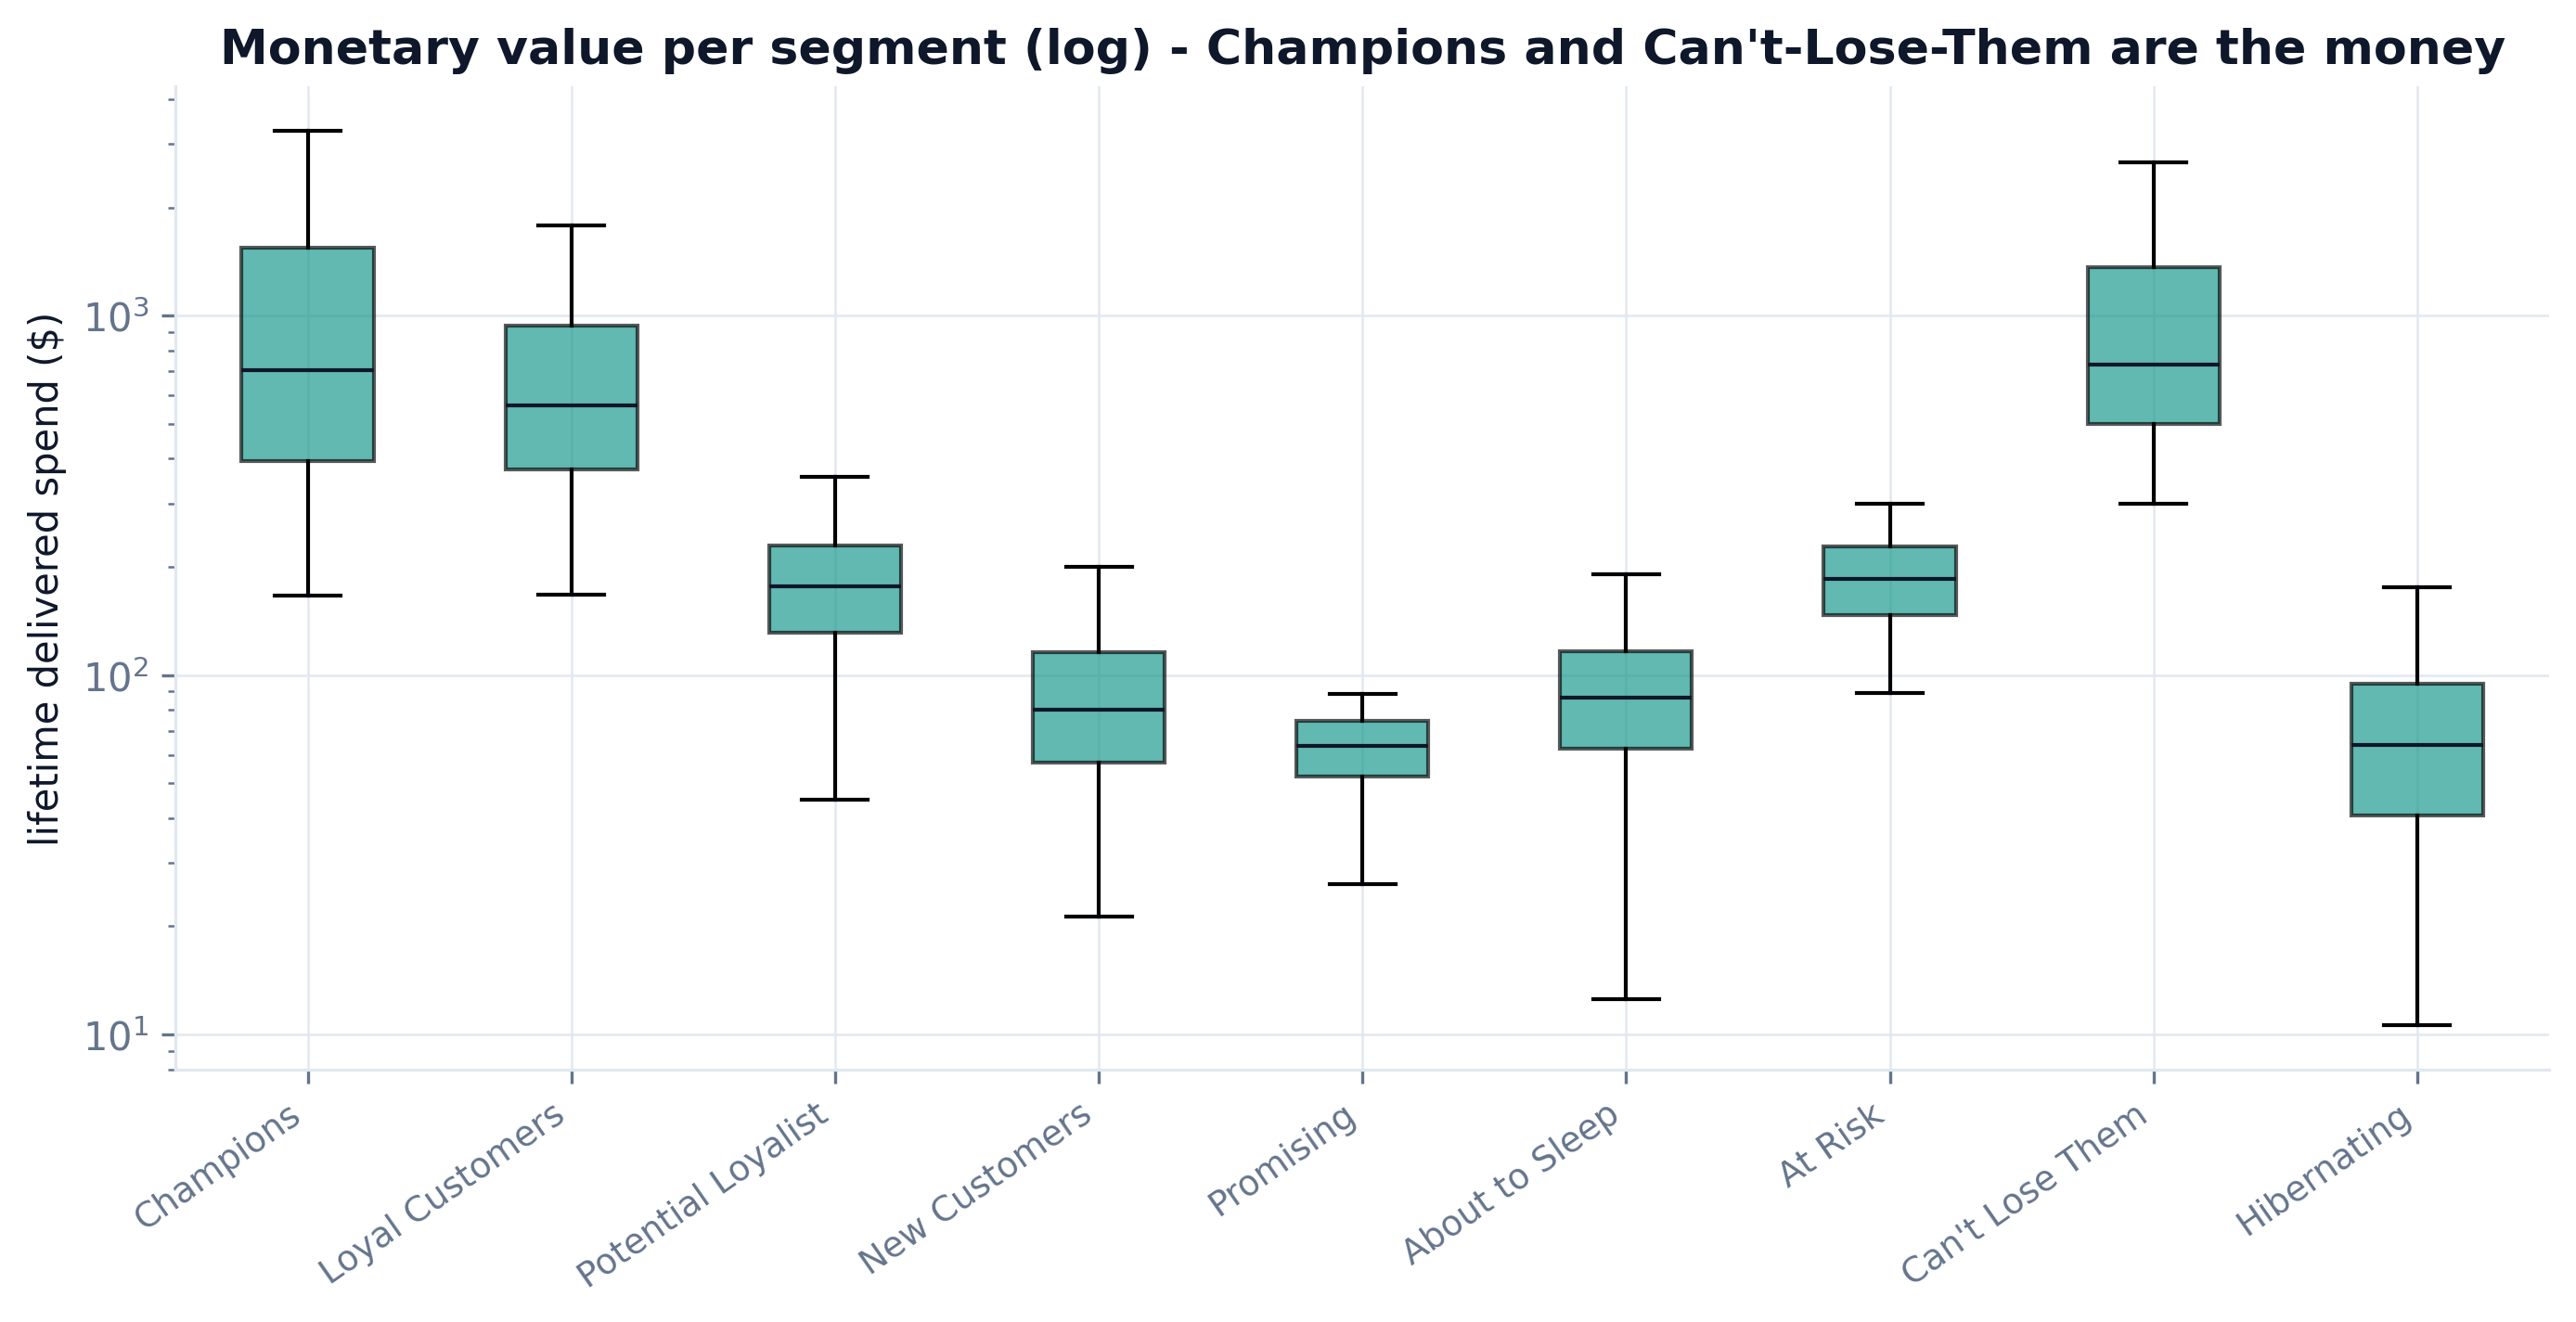
Box plots of monetary value per segment on log scale
Value per segment. Champions and Can't-Lose-Them carry the money; the rest are thin.
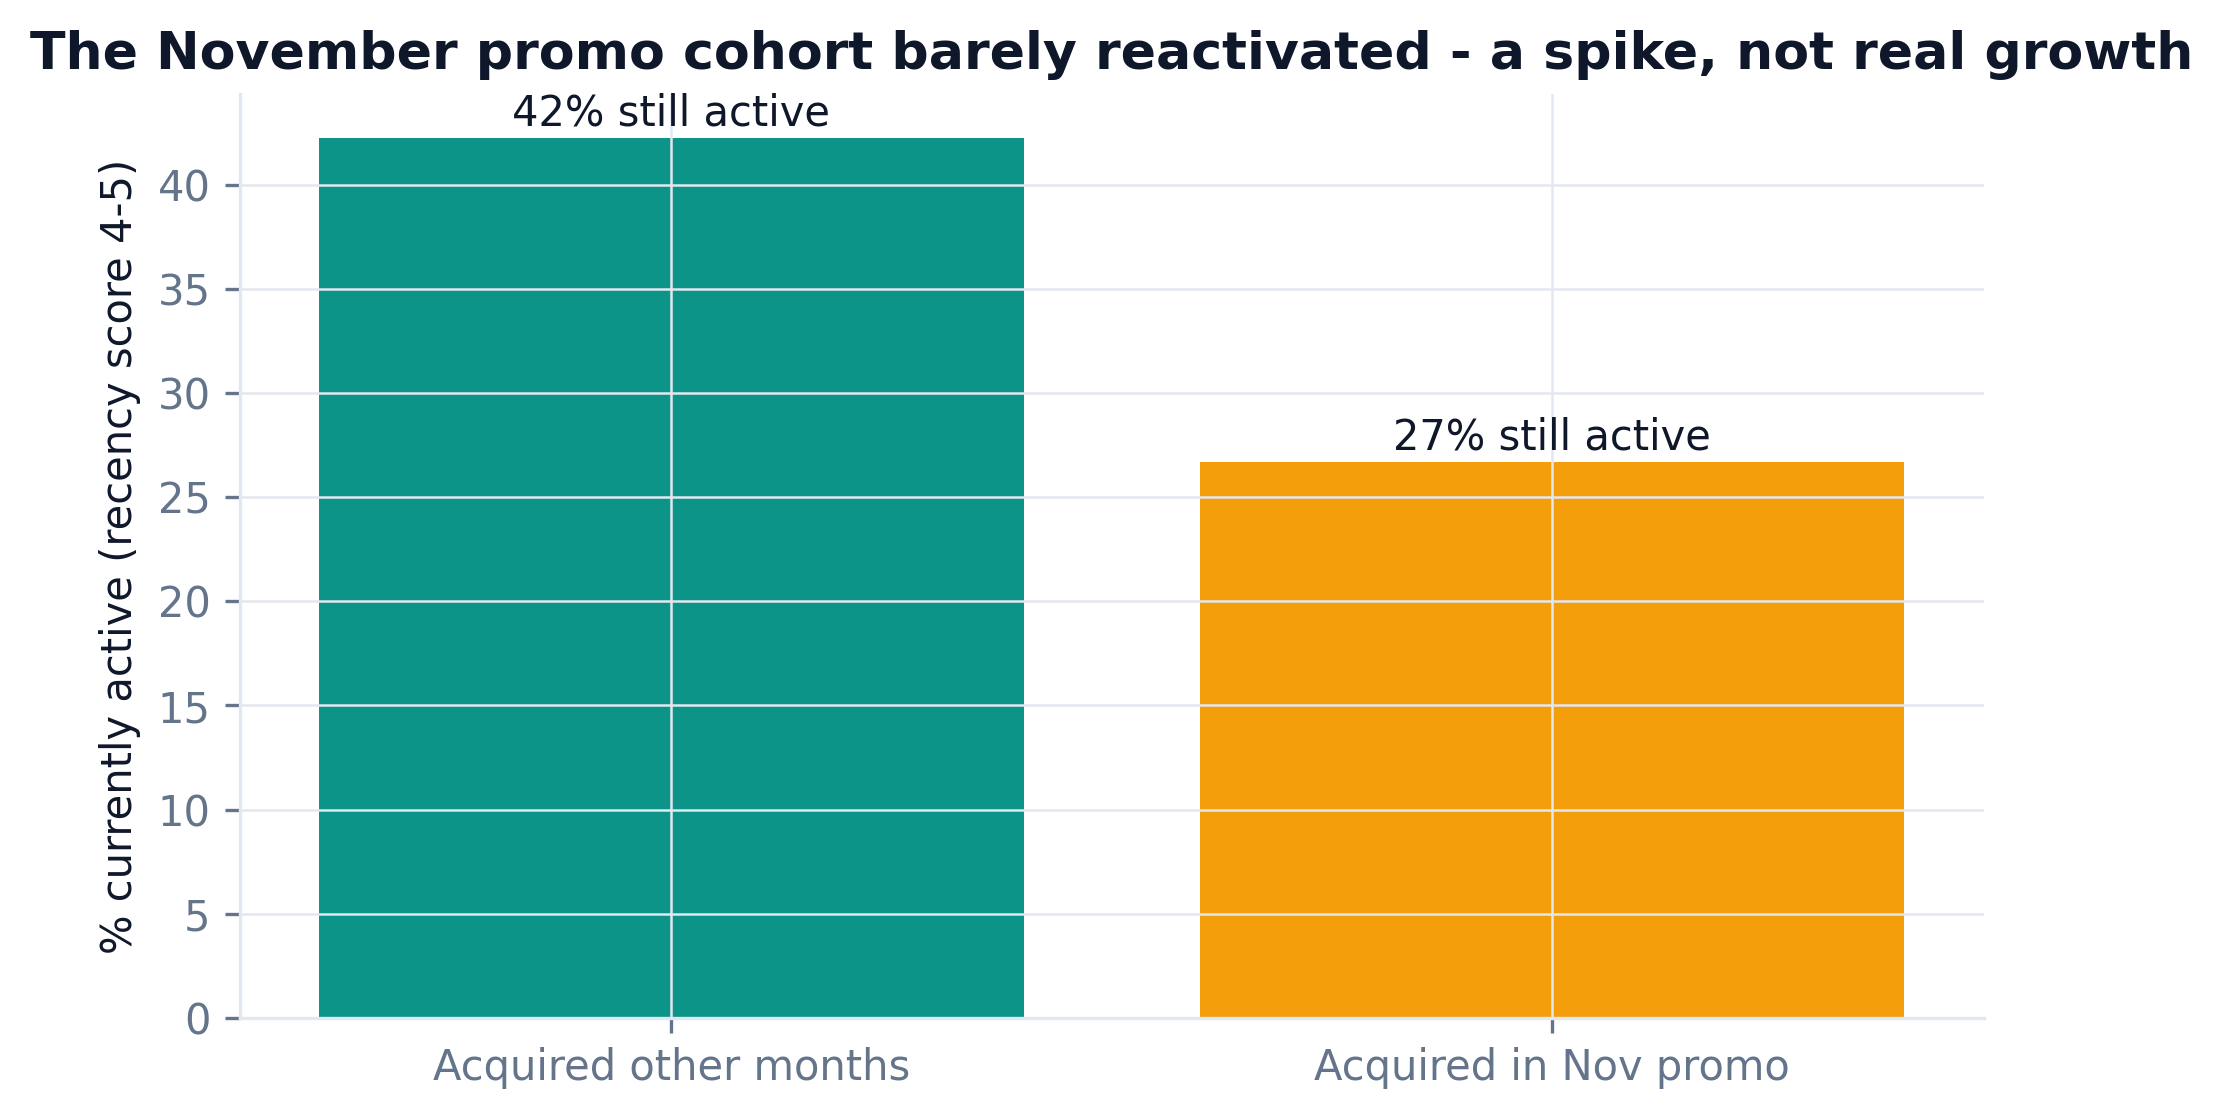
Bar chart: November promo cohort barely reactivated vs other months
Promo mirage. The November cohort barely reactivated - a signup spike, not real growth.
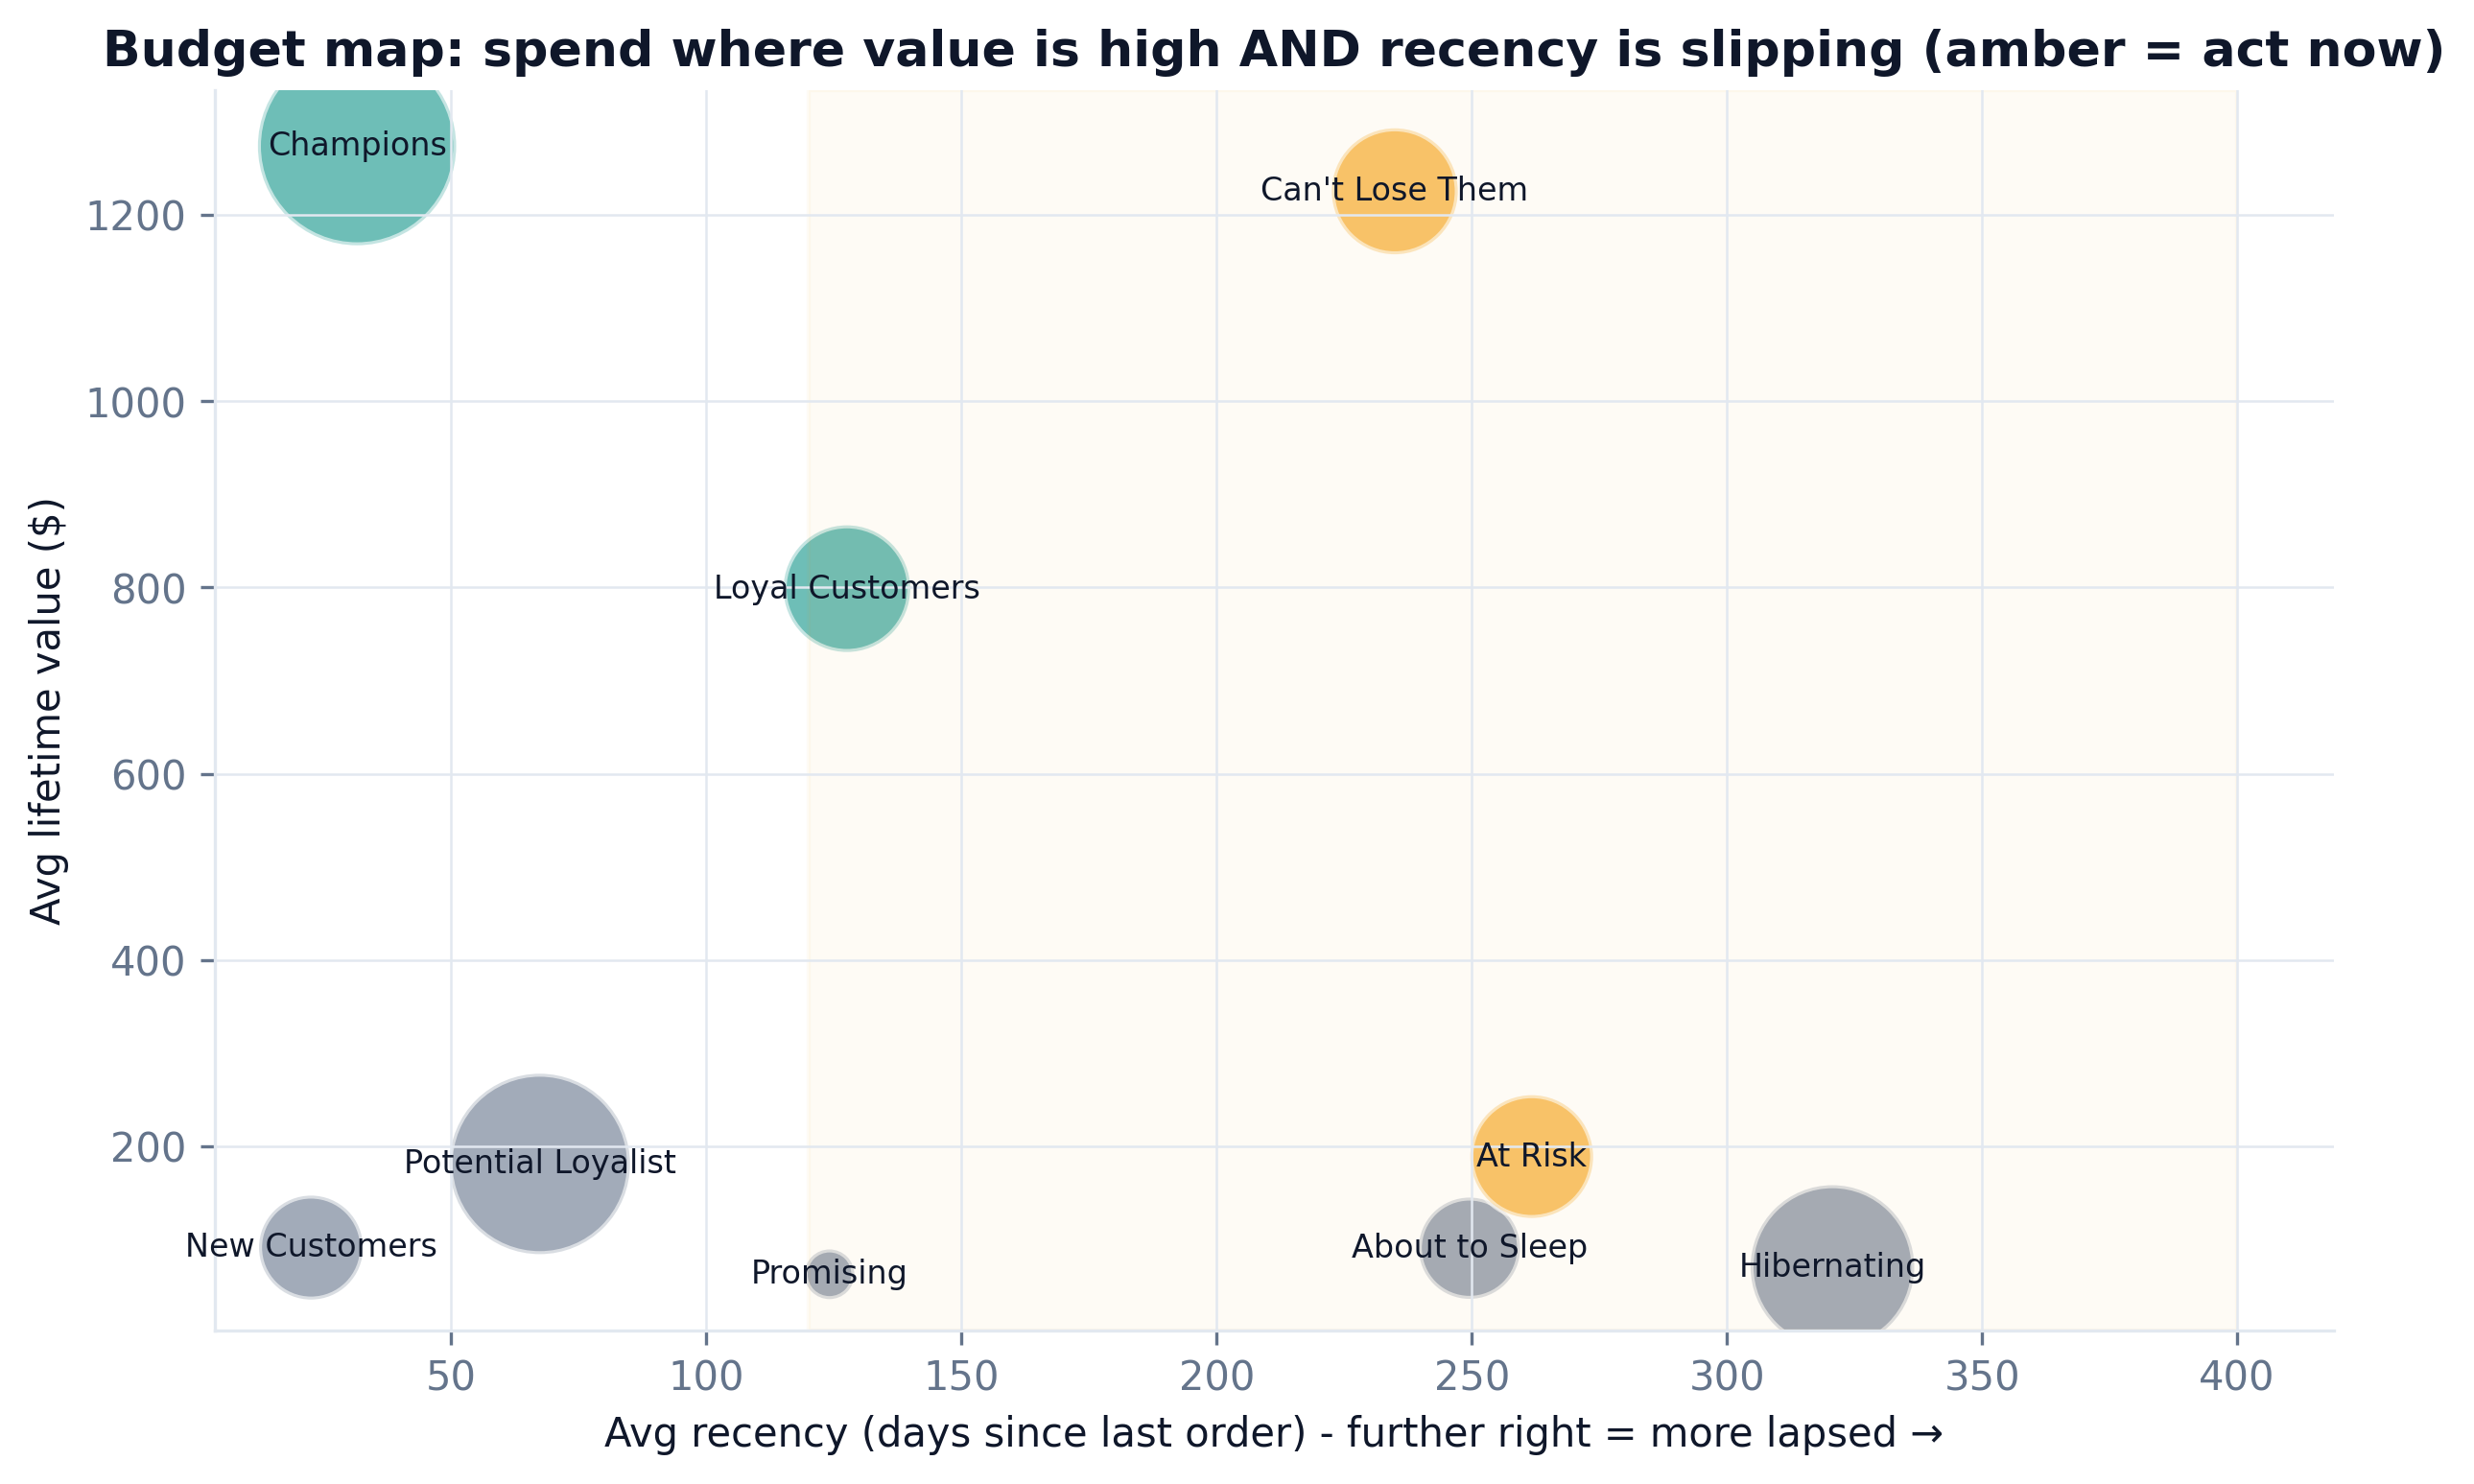
Bubble map of segments by average recency and value, amber marks act-now
The budget map. Spend where value is high AND recency is slipping - amber is the act-now zone.
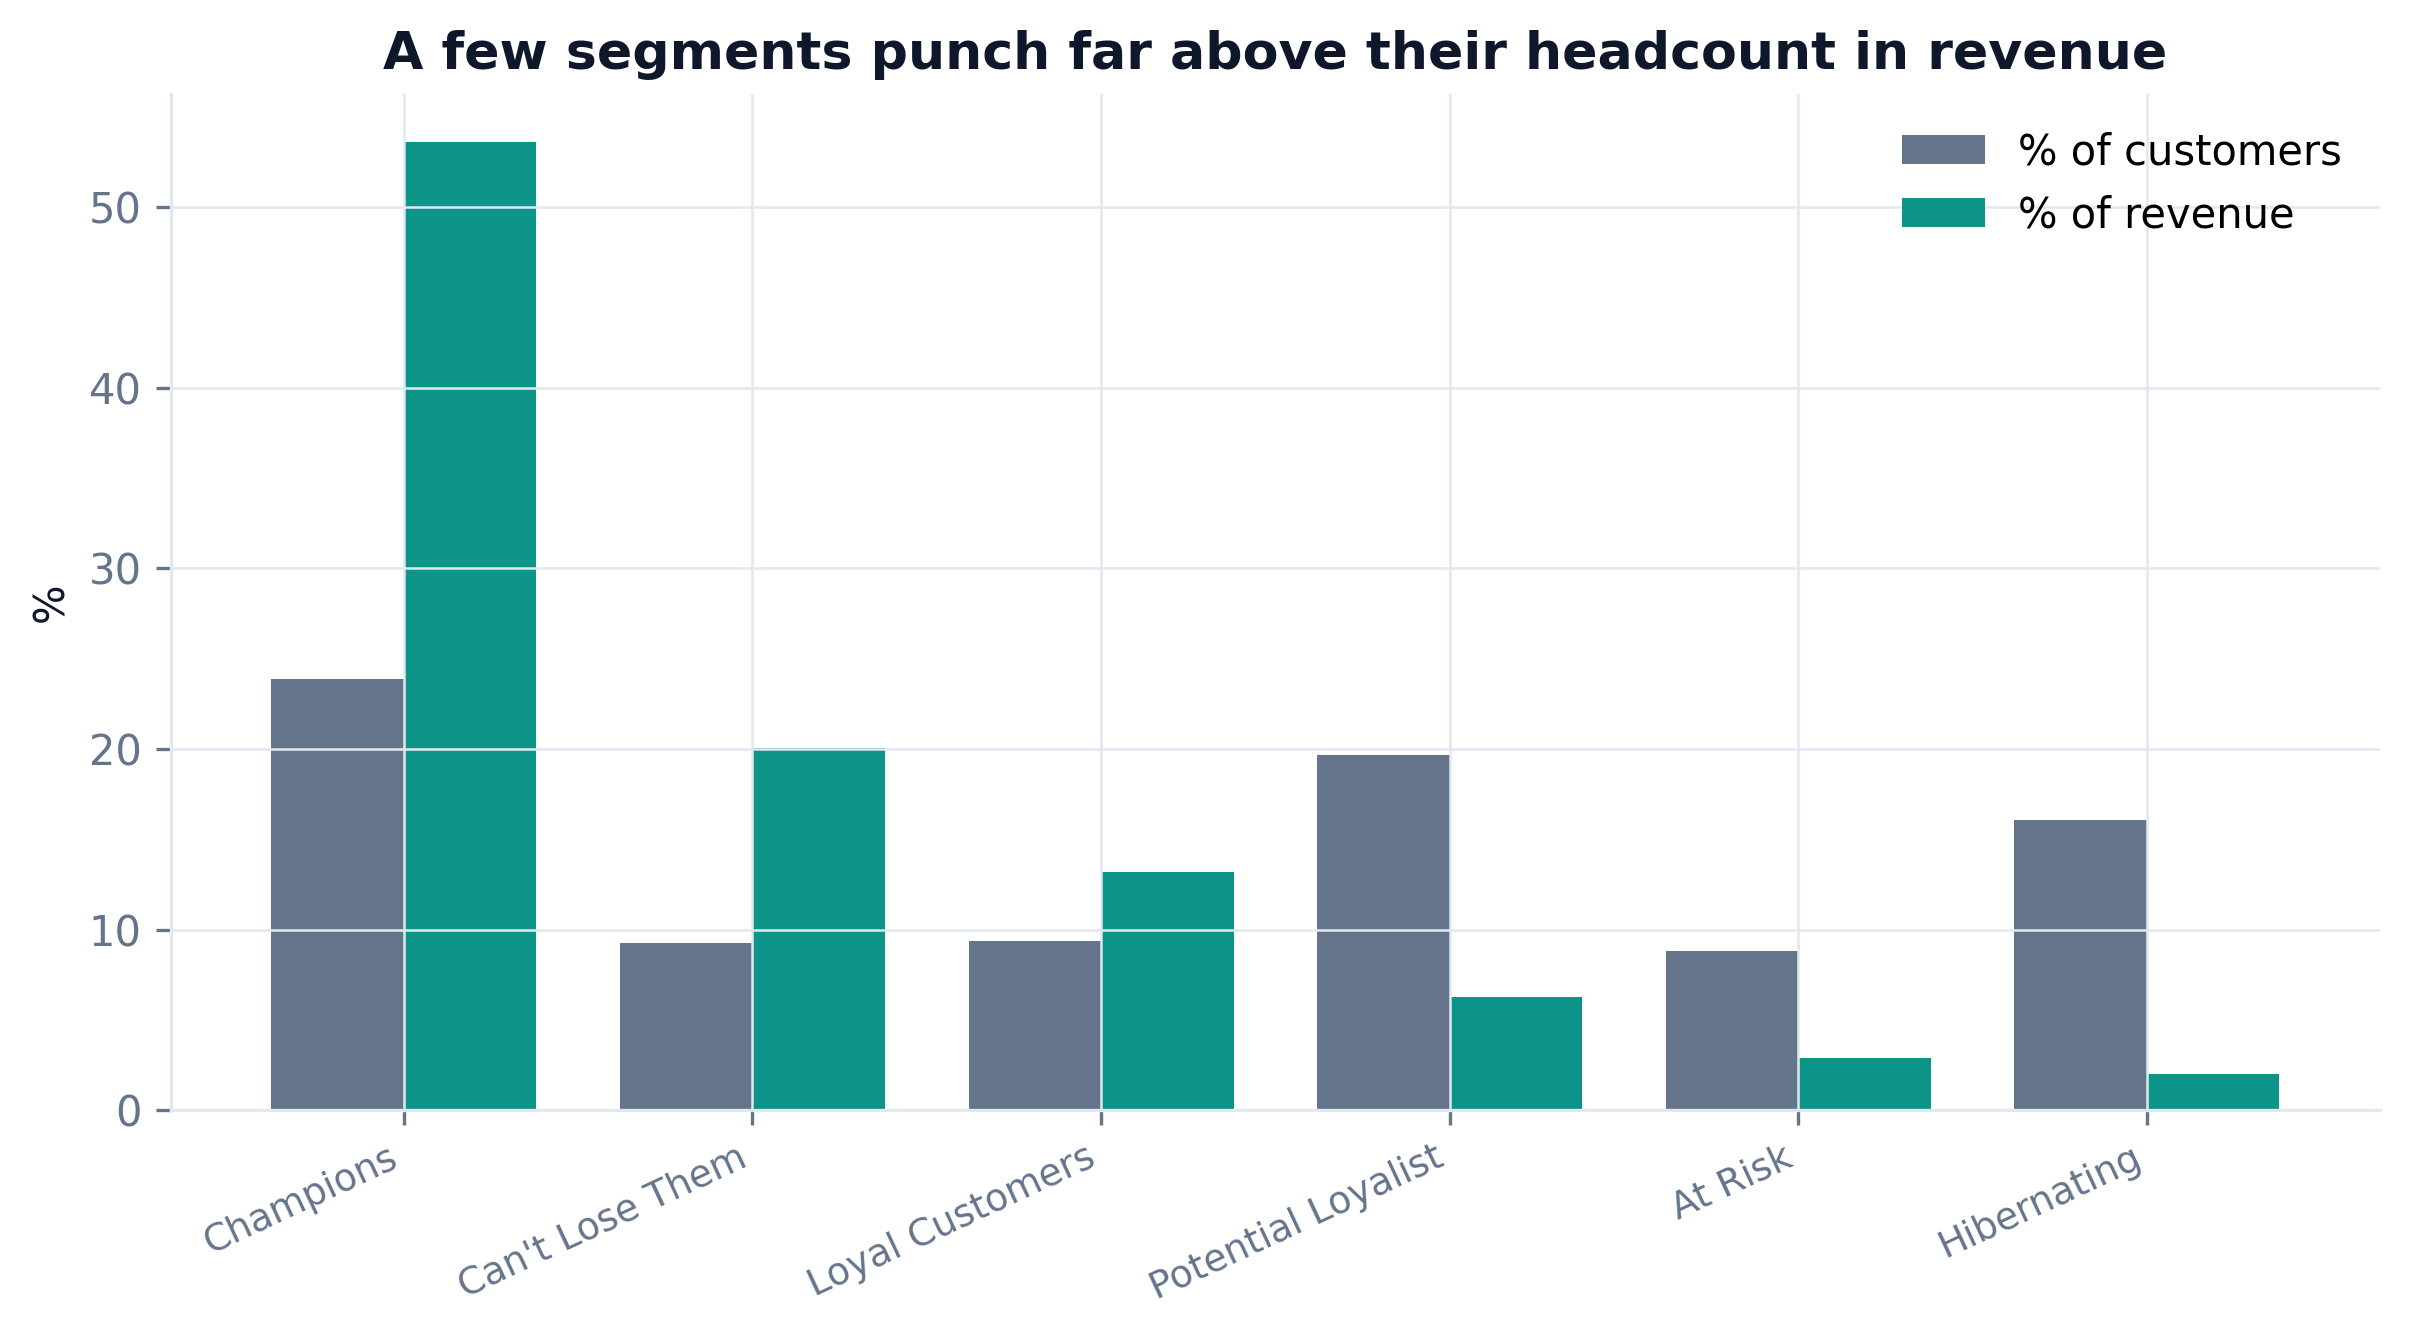
Grouped bars comparing customer share vs revenue share by segment
Punching above weight. A few segments hold far more revenue than their headcount suggests.
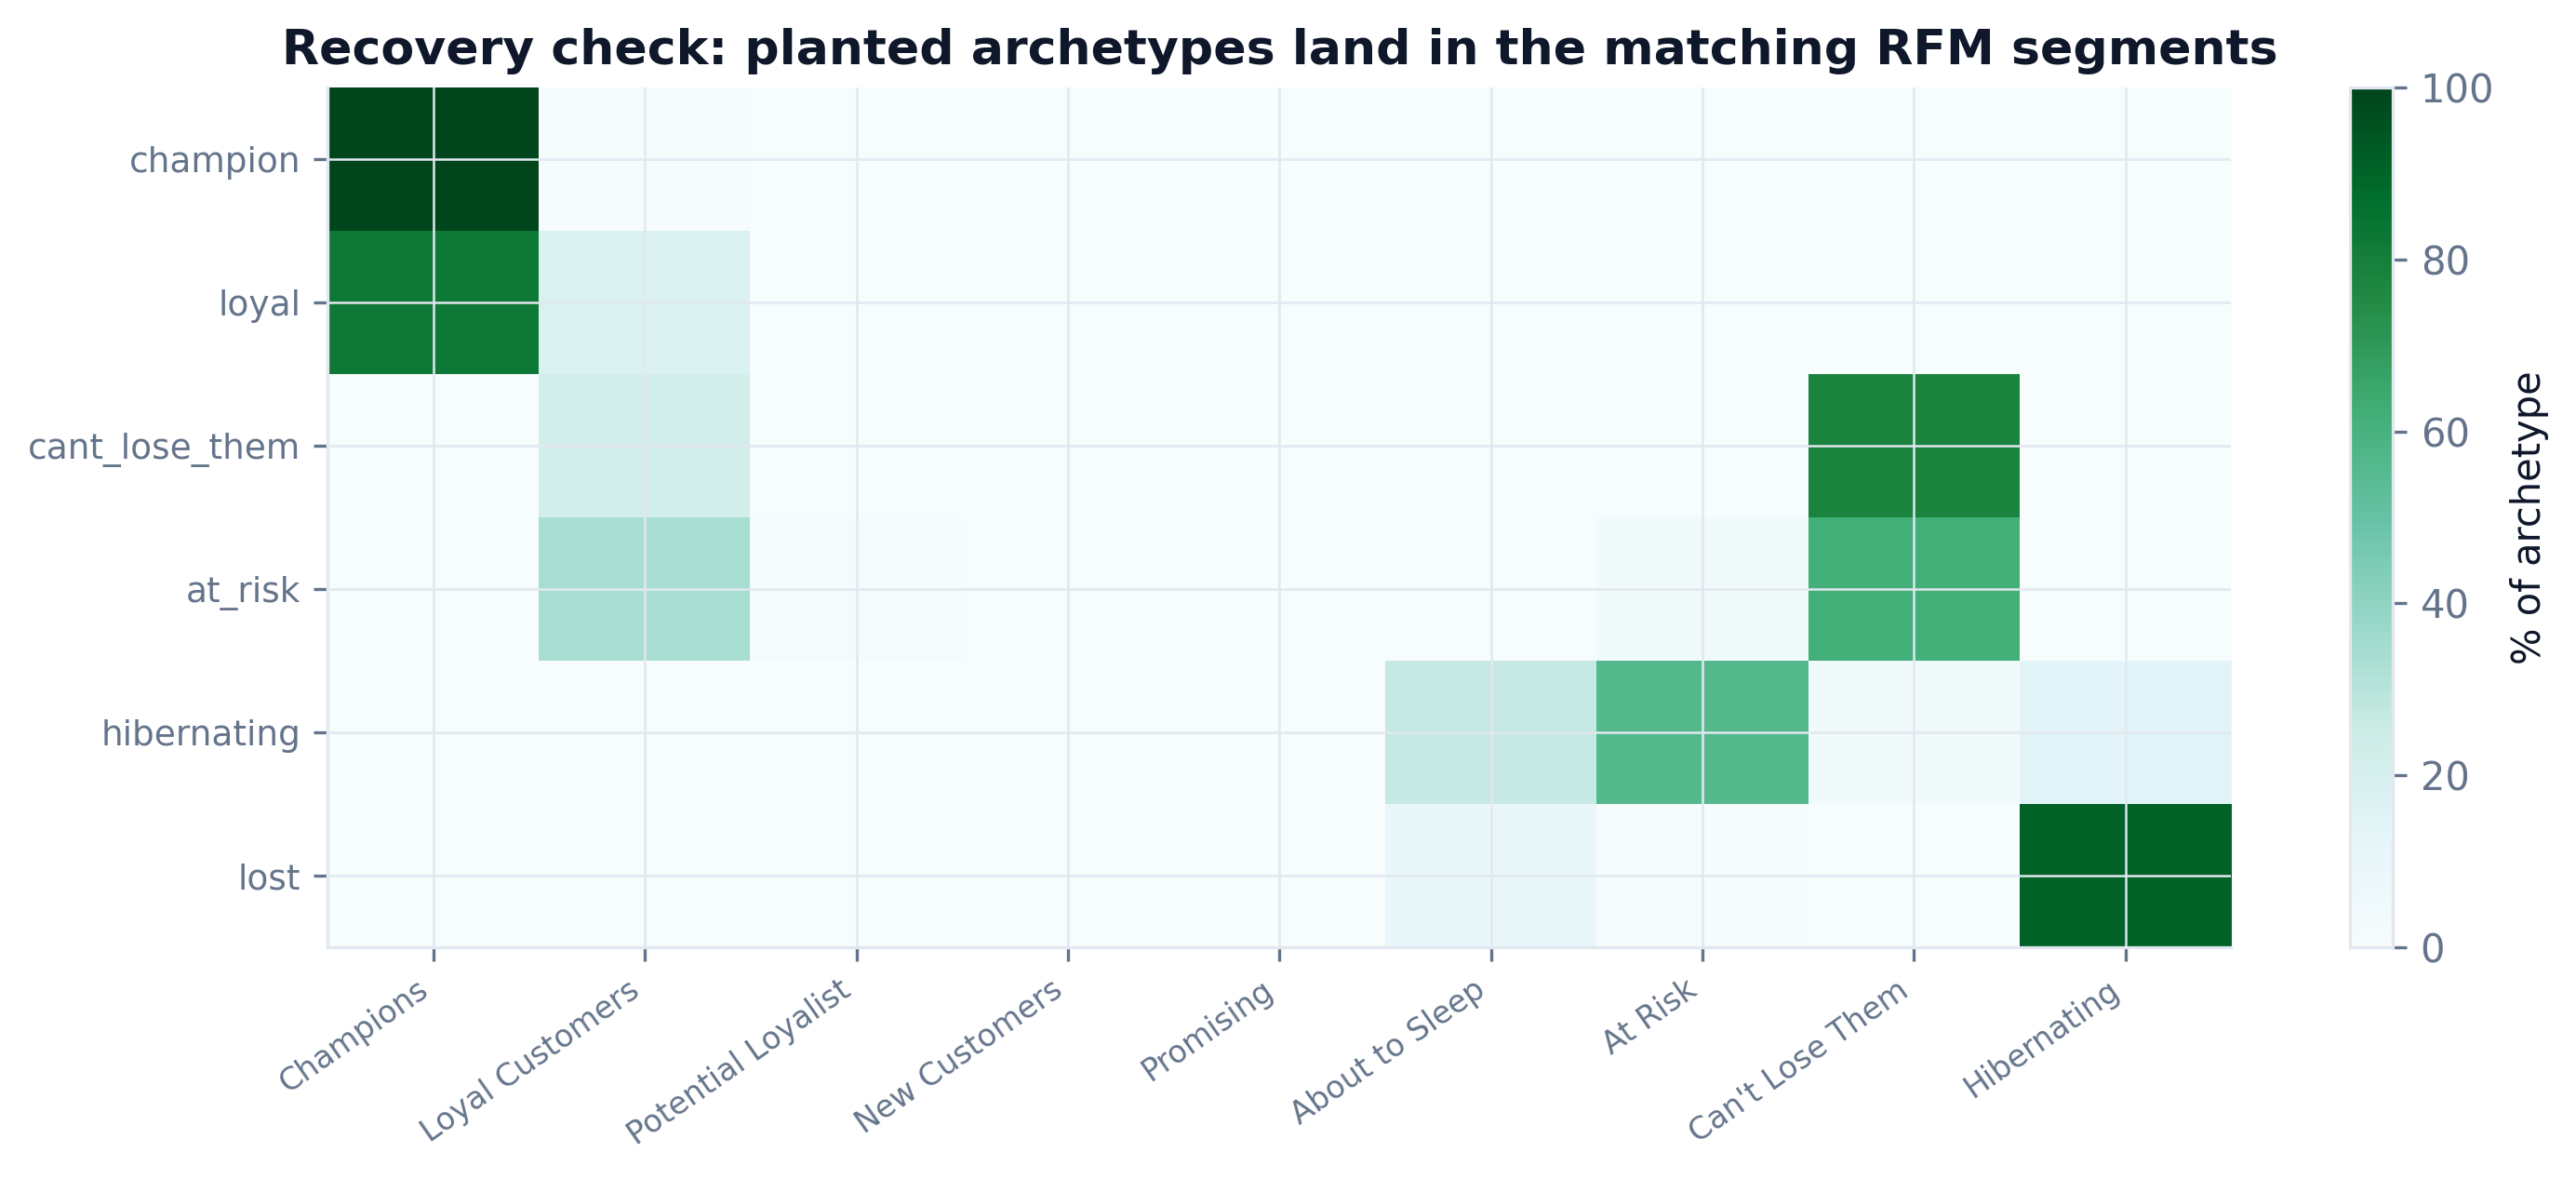
Heatmap validating RFM segments against planted ground-truth archetypes
Recovery check. Planted archetypes land in the matching RFM segments - the method works.
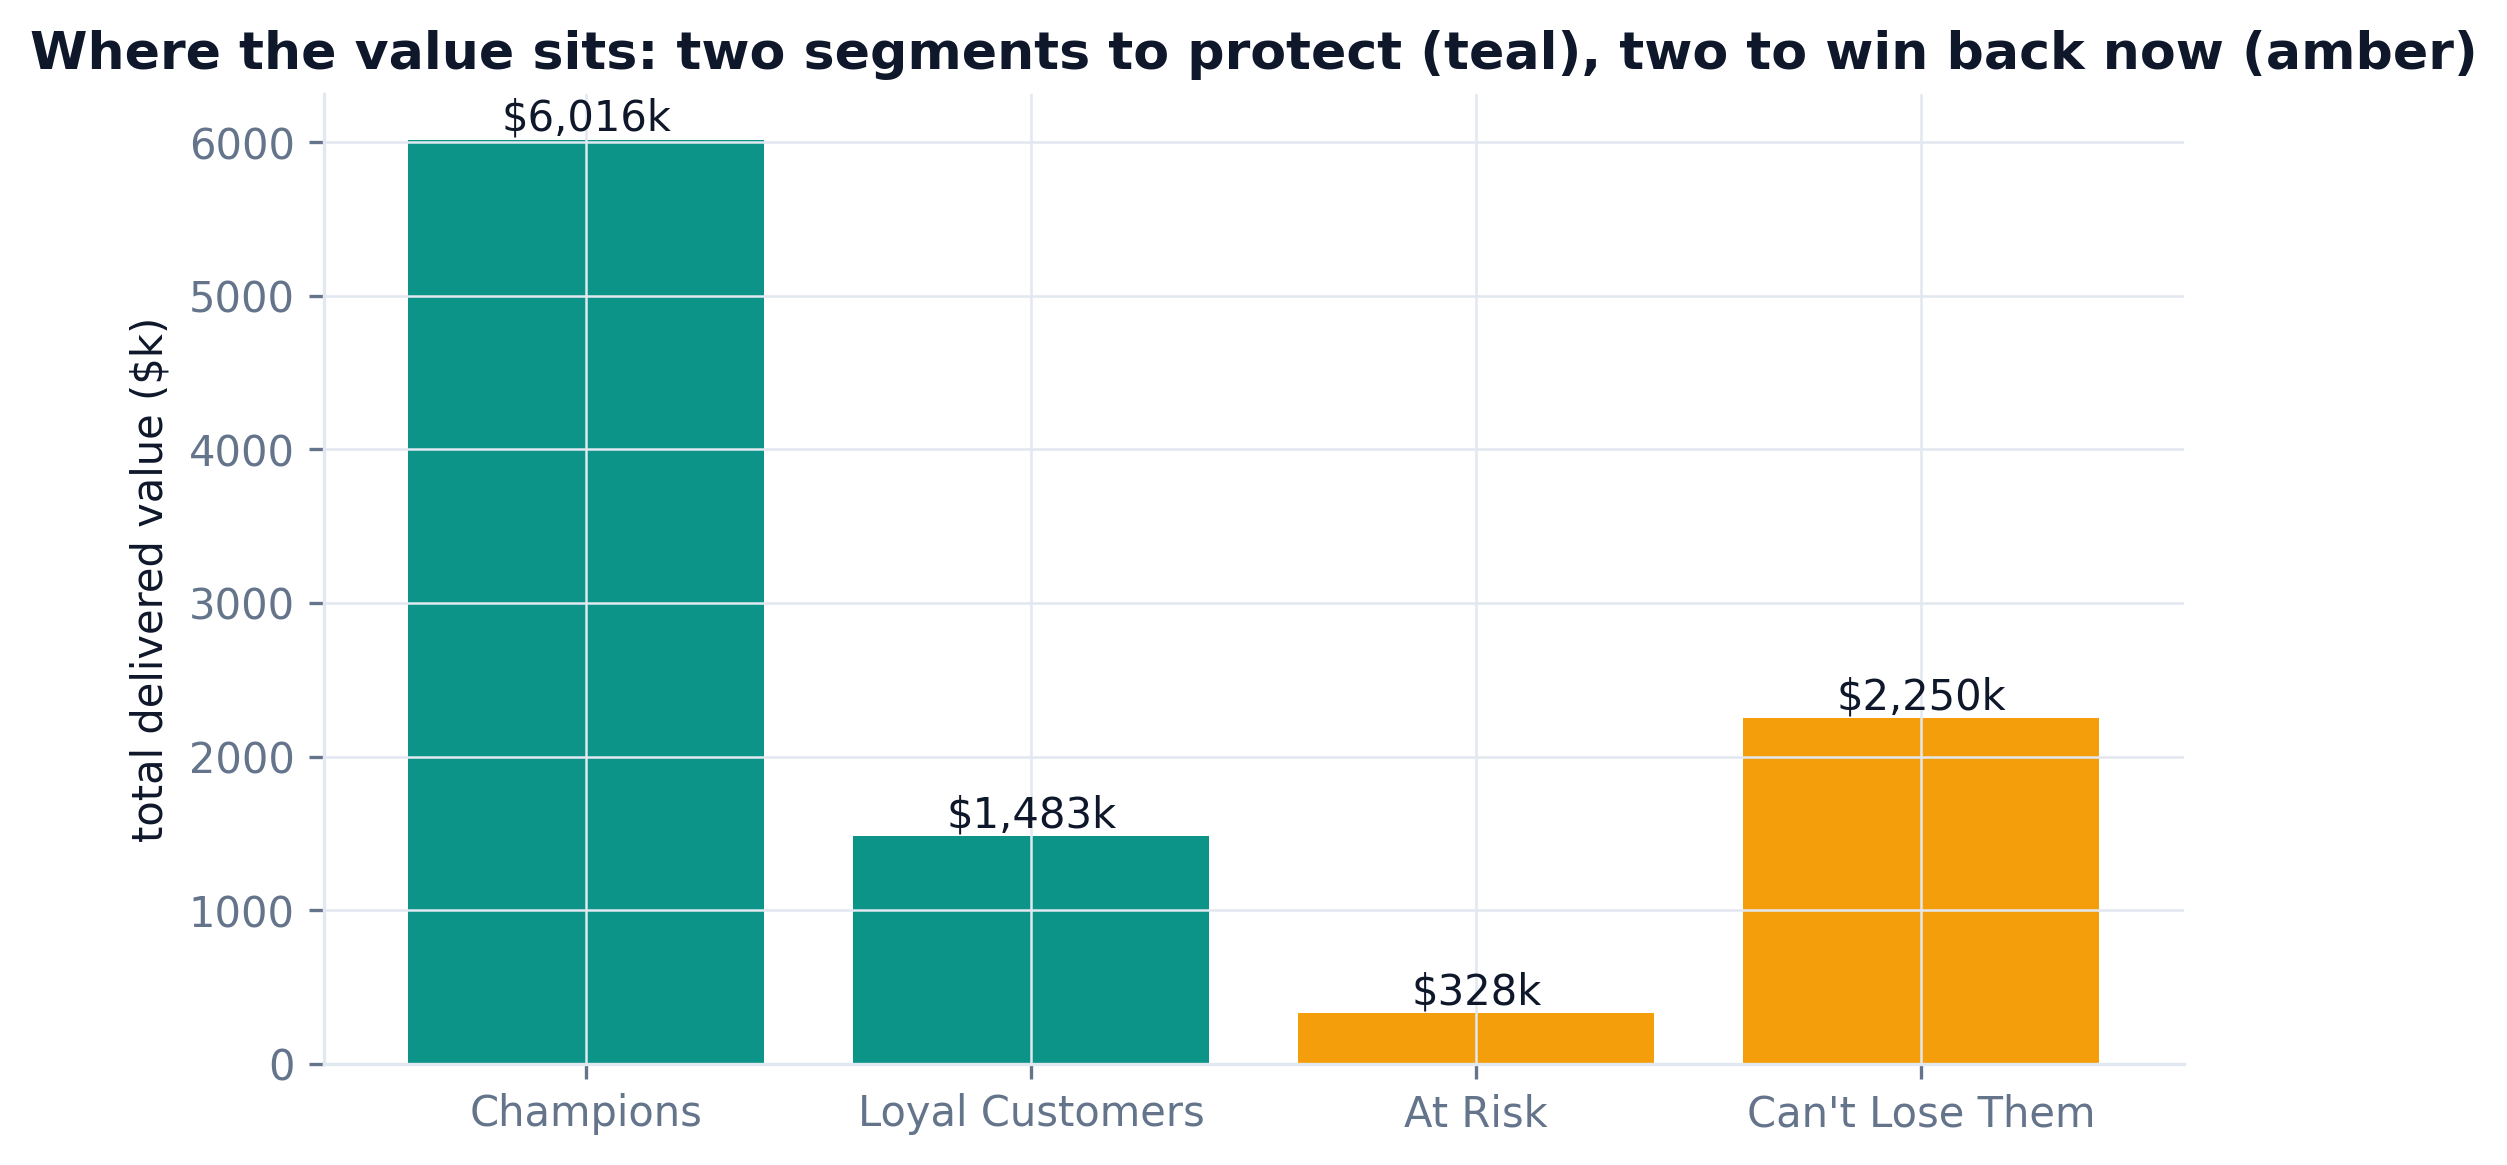
Bar chart of value at stake: two segments to protect, two to win back
The recommendation. Protect Champions + Loyal (teal); win back At Risk + Can't-Lose-Them now (amber).
Planted patternCaught by$ at stakeStatus
Whale concentrationMonetary pareto + treemaptop 5% = 35% of revenue✓ caught
Can't-lose-them lapsersSegment map + budget map$2,249,746✓ caught
Affiliate one-and-doneSegment by channel2,056 customers, $143k✓ caught
Nov promo cohortCohort reactivation bar1,283 lapsed✓ caught
Returns-heavy segmentDelivered-only DQ gate$991k excluded✓ caught
Recovery check (not planted): archetype → segmentValidation heatmapmethod verified✓ confirmed
06
Step 6

Expert review - a check that changes the code

A panel of five senior reviewer agents - each with 10+ years in data, data insights, and business - reviewed the first version (rfm_everrest_v1.py, kept in the repo). Every fix below was applied and the pipeline re-ran; the charts above are the post-review v2.

Senior Data Engineer
12 yrs · code & pipeline

"v1 scored monetary on all orders, including returns. A customer who returns half their orders isn't high-value - gate to delivered revenue first."

Fix applied: monetary + frequency computed on delivered orders only; $991k of returned value excluded.
Analytics Methodology Lead
10 yrs · scoring rigor

"Raw RF codes (55 combos) aren't actionable, and qcut on tied frequency counts is unstable. Use rank and map to named segments."

Fix applied: frequency scored on rank; standard 11-segment map; recency from a fixed reference date.
Data Insights Lead
11 yrs · segment framing

"The channel view is missing - that's where the affiliate one-and-done story lives. And a raw RF-code bar has no action attached."

Fix applied: added segment-by-channel, treemap and budget map; dropped the RF-code bar; every title is a finding.
Commercial / Business Lead
14 yrs · budget ROI

"A segmentation the CRM lead can't spend against is a poster. Which segment gets the next dollar, and what's it worth?"

Fix applied: every segment carries a $ figure; findings.md ranks the budget priorities, Can't-Lose-Them first.
Data QA & Reproducibility
10 yrs · trust & recall

"Prove the segments mean something. Check them against the planted archetypes on a clean re-run."

Fix applied: validation heatmap confirms archetypes land in the matching segments; fixed seed + ref date, byte-identical.
before → after ↗ · the score that lied
# v1 (before): monetary on ALL orders - returns counted as value
rfm = orders.groupby("customer_id").agg(monetary=("order_value","sum"))

# v2 (after): delivered-only - $991k of returns removed before scoring
deliv = orders[orders.status == "delivered"]
rfm = deliv.groupby("customer_id").agg(monetary=("order_value","sum"))

Run this skill on your own customers

Install once, hand Claude your transaction tables - the same 6 steps segment your customer base and rank the retention spend.

terminal
/plugin marketplace add phoebefu6/phoebe-data-skills
/plugin install how-to-rfm@phoebe-data-skills