Style Vault / Creative / Handmade Census
Handmade Census
SV-048
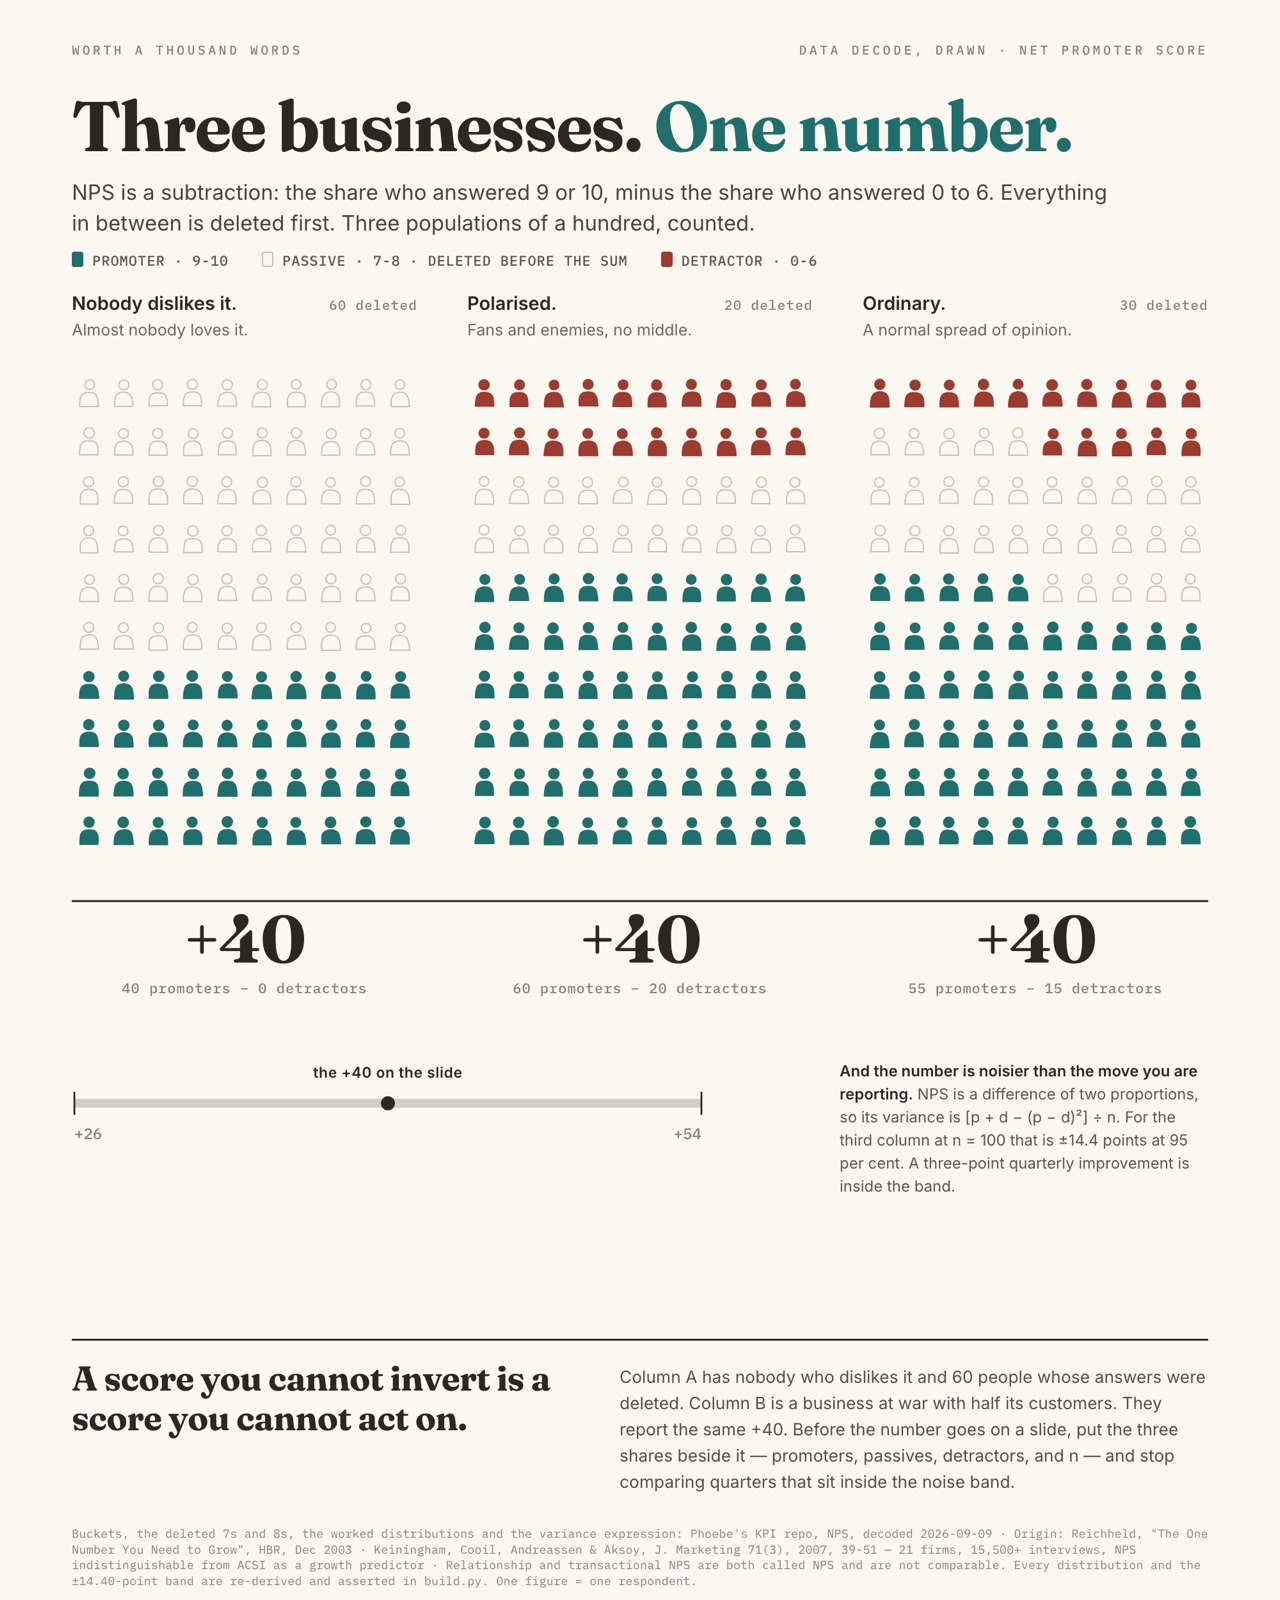
My own work in this style: Three businesses. One number.
In plain words
A chart where every unit is a small hand-made figure, like a clay person or a fabric doll, lined up so that more people means more figures, never bigger ones. Warm domestic light and visible thumbprints sit on top of real counts. The style is honest statistics wearing the most handmade material possible.
Topics it fits
- Workforce and people analyticsone crafted figure per employee reminds the reader every number is a person
- AI impact on jobsrows of handmade figures make a statistic about roles feel human without losing accuracy
- Inclusion and culture storiesthe warm craft texture invites empathy while the unit discipline keeps the counts honest
- Learning community growthadding one small figure per learner turns enrolment numbers into a visible crowd
Art style and layout
- core locked [each_unit_is_a_crafted_figure, real_data_underneath, warm_intimate_palette, isotype_discipline_units_never_scale]
- the tension statistical rigor (real trajectories, honest counts) wearing the most anti-statistical medium possible (clay, fabric, thumbprints)
- composition unit-chart / isotype logic - more people = more figures, never bigger figures
What must stay, what may change
subject - any population of people/things; the crafted-figure-as-datapoint stays
As JSON
Paste this into a prompt or a skill to reuse the style.
{
  "id": "SV-048",
  "name": "Handmade Census",
  "audience": [
    "creative"
  ],
  "category": [
    "data-viz",
    "craft-material"
  ],
  "format": [
    "isotype",
    "chart"
  ],
  "maker": "hybrid",
  "keep_and_swap": "subject - any population of people/things; the crafted-figure-as-datapoint stays",
  "style_dna": {
    "core_locked": "[each_unit_is_a_crafted_figure, real_data_underneath, warm_intimate_palette, isotype_discipline_units_never_scale]",
    "the_tension": "statistical rigor (real trajectories, honest counts) wearing the most anti-statistical medium possible (clay, fabric, thumbprints)",
    "composition": "unit-chart / isotype logic - more people = more figures, never bigger figures"
  },
  "topics": [
    {
      "topic": "Workforce and people analytics",
      "why": "one crafted figure per employee reminds the reader every number is a person"
    },
    {
      "topic": "AI impact on jobs",
      "why": "rows of handmade figures make a statistic about roles feel human without losing accuracy"
    },
    {
      "topic": "Inclusion and culture stories",
      "why": "the warm craft texture invites empathy while the unit discipline keeps the counts honest"
    },
    {
      "topic": "Learning community growth",
      "why": "adding one small figure per learner turns enrolment numbers into a visible crowd"
    }
  ]
}