The leader track 🤝 · for C-level, managers & curious minds · 6 x 45 min · no code to write
Thinking mode: why a top-line number names an outcome not a cause, the difference between leading drivers you steer by and lagging outcomes you report, how to read a drop off a tree in thirty seconds, and how to run the weekly business review and monthly summit as decomposition rituals - each session ends with questions to ask your data team.
Why a number needs a tree
A top-line metric is an outcome, not a cause. The driver-tree mindset: break every number into the levers that move it, each with an owner.
🚦 Leader 2 · easyLeading vs lagging
Lagging outcomes report late; leading drivers warn early. Which numbers you steer by and which you only report - and why the difference matters.
🪜 Leader 3 · easyDecompose and read a drop
The three decomposition patterns and the diagnosis walk: given a fall, trace it down the tree to the single driver that moved.
🗺️ Leader 4 · mediumThe six domains side by side
One driver tree per business model - ecommerce, marketing, branding, traffic, B2B SaaS, B2G - so you read any team's top line the same way.
📅 Leader 5 · mediumThe weekly business performance review
Run the Amazon-style weekly review as a tree-reading ritual: glance at the drivers, spot what moved, route the question before the meeting ends.
🏛️ Leader 6 · mediumThe monthly leadership summit review
The monthly zoom-out: trees across the business on one page, Goodhart's law when a driver becomes a target, and metric governance.
The builder track 🛠️ · for practitioners · 10 sessions x 45 min (b10: 60) · live driver-tree simulator + DuckDB SQL
One skill, ten sessions: take any top-line metric, break it into a driver tree, and diagnose a drop in minutes. Every page runs a live driver-tree simulator - edit a leaf and the top line recomputes; press "Simulate a drop" and the guilty driver's path lights coral so you practise tracing a fall back to its cause. Then real DuckDB via WebAssembly segments the guilty driver with live SQL to find the culprit slice. You start with a GMV tree (b1), learn the three decomposition patterns (b2) and the leading-indicator diagnosis playbook (b3), then apply all of it to six domains one at a time (b4-b9) before a capstone where a metric drops and you diagnose it end to end (b10). The engine loads once from a CDN (about 8 MB, cached); everything after that is offline.
Your first driver tree
Build GMV = Traffic x Conversion x AOV live, edit a leaf and watch the top line move, then simulate a drop and read the coral path back to the cause.
🧩 Builder 2 · easyThe three decomposition patterns
Multiply, add, and the flow bridge. Decide which pattern any metric follows, and build a tree in each shape in the simulator.
🔍 Builder 3 · easyLeading indicators and the diagnosis playbook
Push a tree deep enough that the leaves warn early, then run the repeatable playbook that takes a drop to a root cause.
🛒 Builder 4 · mediumEcommerce deep dive
Decompose GMV into its real drivers, simulate a drop, then segment the guilty driver with live SQL to find which channel fell.
📣 Builder 5 · mediumMarketing deep dive
Build the funnel tree - spend to impressions to clicks to leads to CAC - and find exactly where the funnel leaks when performance dips.
✨ Builder 6 · mediumBranding deep dive
Decompose the softer metrics: the brand funnel from awareness to preference, and share of search as a leading driver of demand.
🌐 Builder 7 · mediumInternet and traffic deep dive
Ad revenue and the DAU bridge: decompose an audience business into the drivers of reach, engagement, and monetisation.
💳 Builder 8 · mediumB2B SaaS deep dive
The ARR bridge - new, expansion, contraction, churn - plus pipeline coverage as the leading driver of the number next quarter.
🏛️ Builder 9 · mediumB2G deep dive
Decompose government bookings and the tension every public-sector tree carries: mission outcomes versus money, both on the same page.
📉 Builder 10 · hands-on · 60 minCapstone: diagnose the drop
A metric drops with no explanation. Build the tree, simulate, segment, and write the weekly-business-review narrative that names the cause.
Metric decomposition is the reading skill under every dashboard. It pairs with learn-business-intelligence-with-phoebe (the dashboards these trees live in), sits on top of learn-data-warehouse-with-phoebe (where the numbers come from), and goes deeper on one domain in learn-marketing-attribution-with-phoebe.
Built from Lean Analytics (Croll & Yoskovitz), DuPont driver-tree analysis, the Amplitude North Star Playbook, and the Amazon Weekly Business Review - frameworks applied live in the simulator, not just described.
Choose your path 🗺️
Two doors, one skill. Leaders never write code; builders never sit through theory they have not just run themselves in the simulator.
The knowledge map 🧠
Both tracks at a glance - hover a session to spotlight its concepts, click any node to jump in.
The whole course on one sheet 📐
Seven modules: both tracks, why a number is useless on its own, the three shapes every metric takes, the builder ladder, the six domains it is worked in, the traps that make a tree lie, and the two rituals that turn tree-reading into a habit.
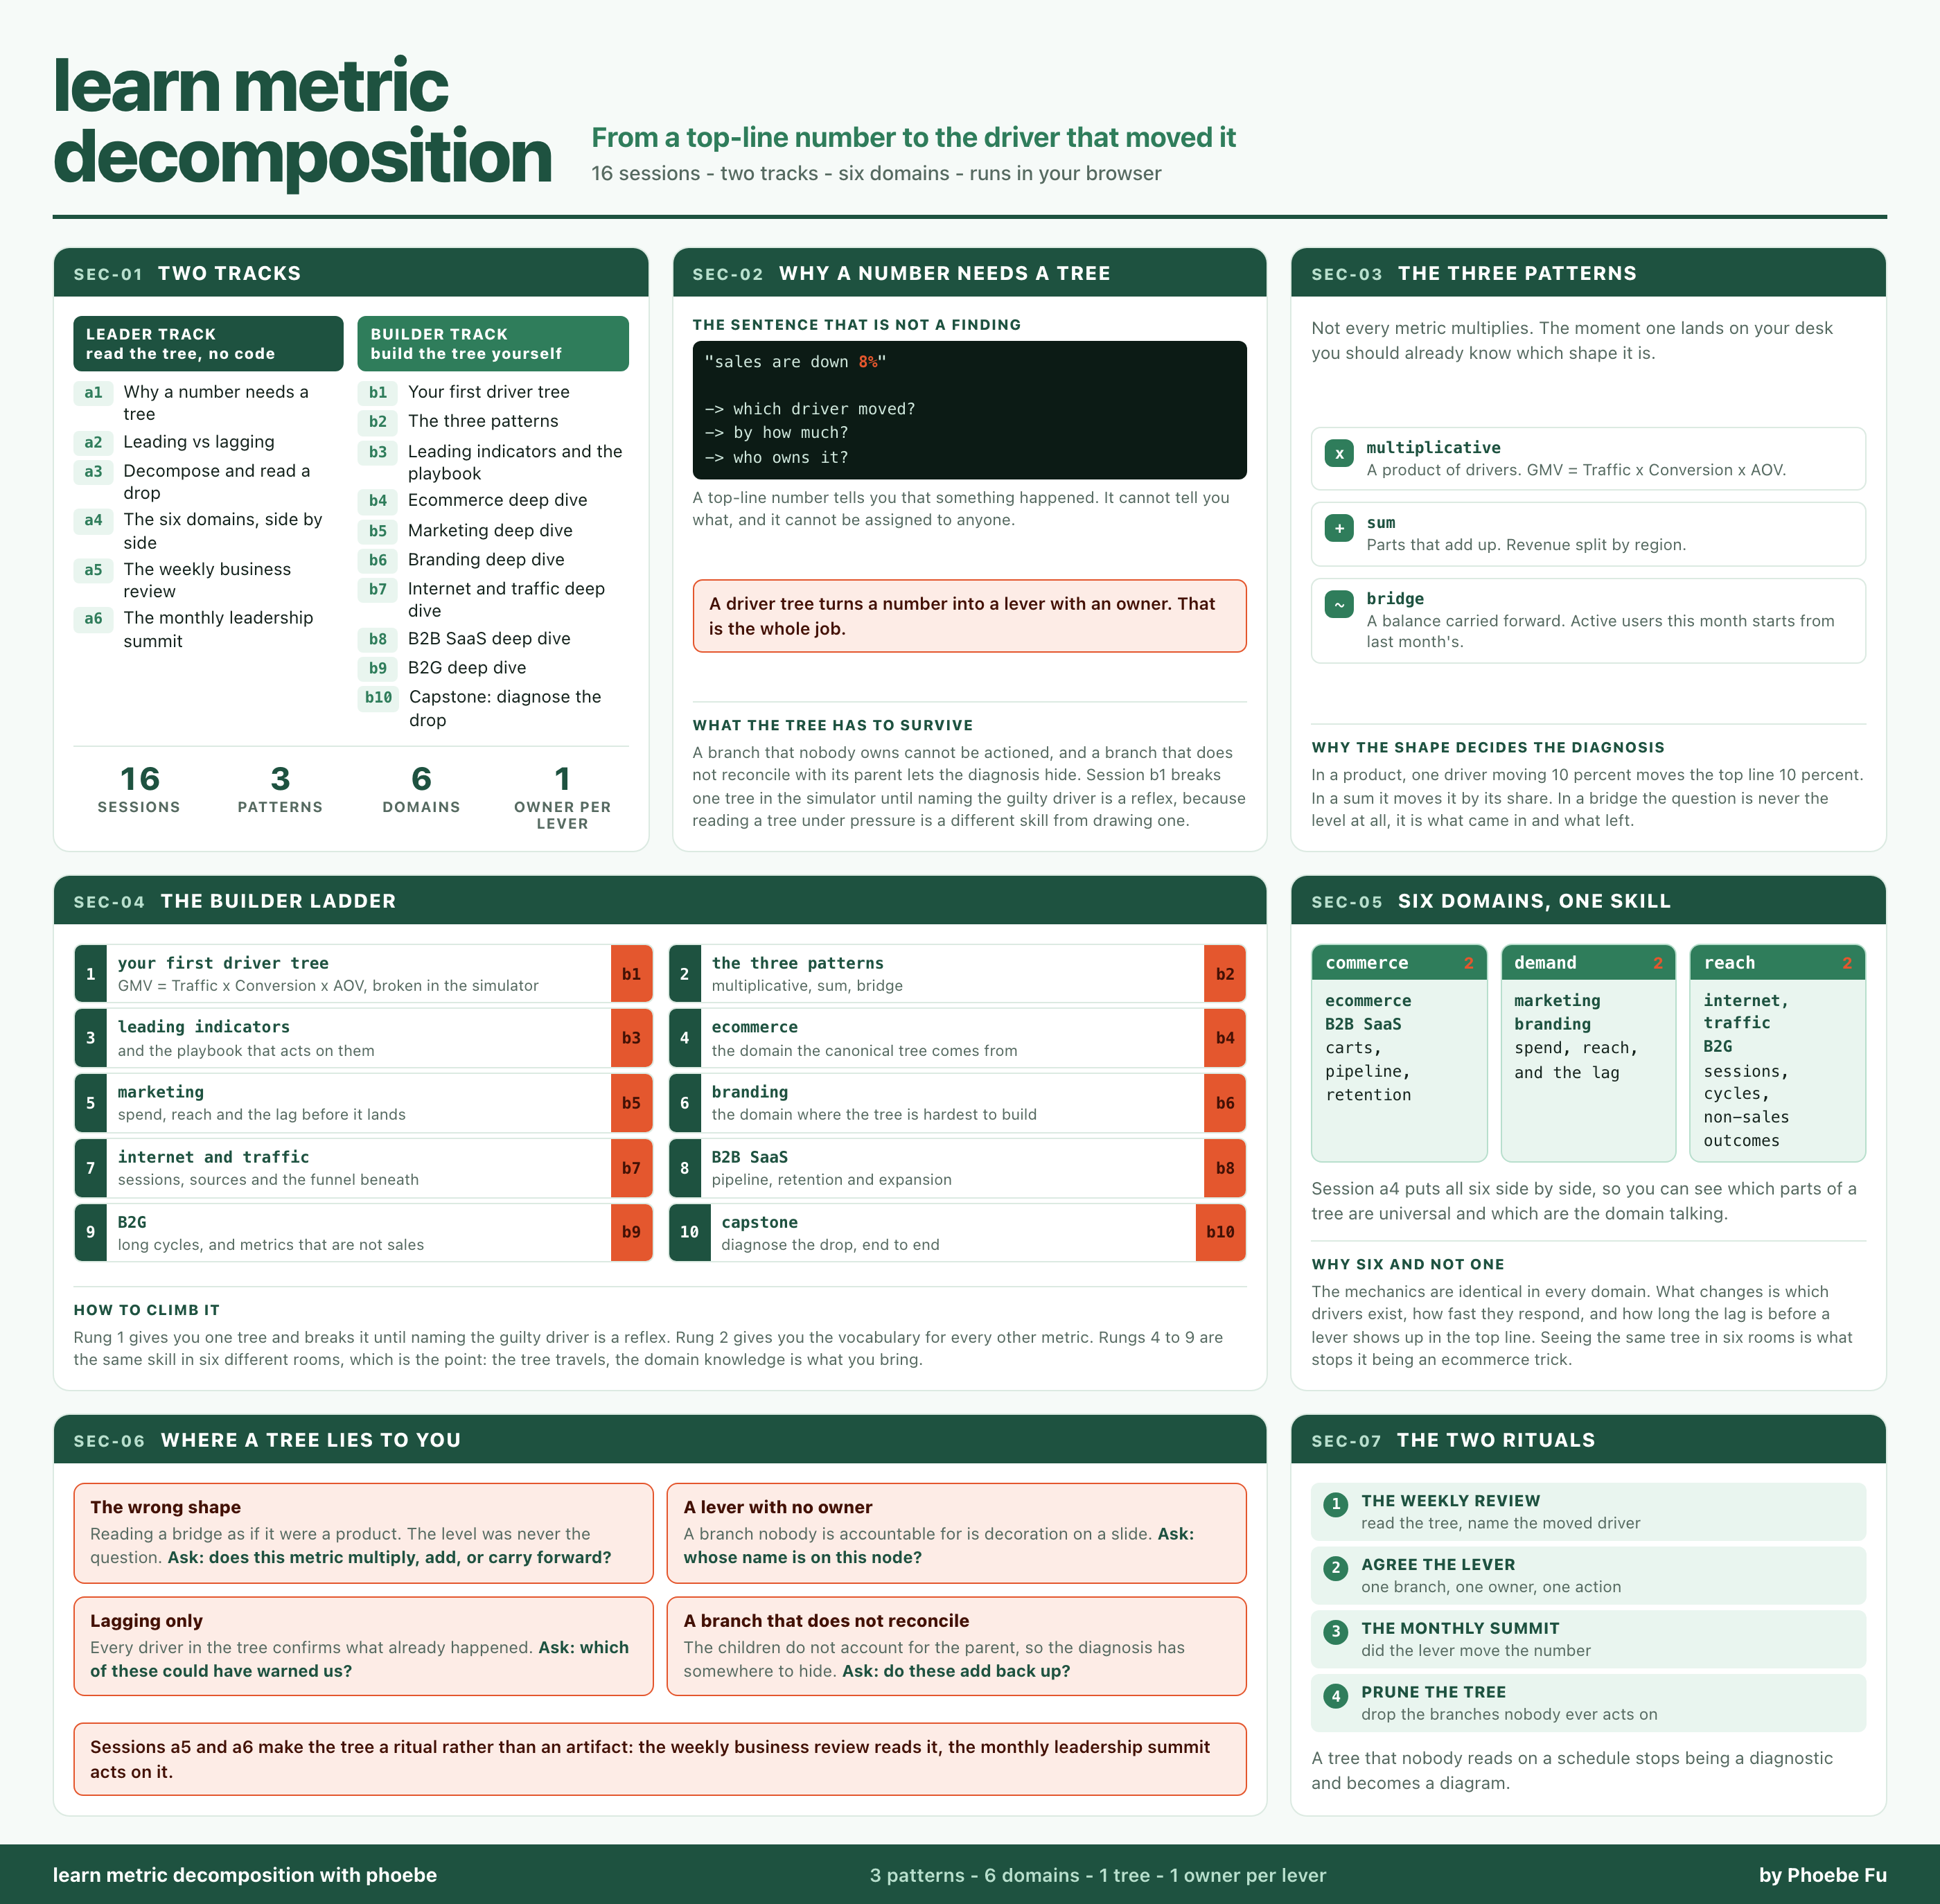
learn metric
decomposition
SEC-01 TWO TRACKS
LEADER TRACK
read the tree, no code
- a1Why a number needs a tree
- a2Leading vs lagging
- a3Decompose and read a drop
- a4The six domains, side by side
- a5The weekly business review
- a6The monthly leadership summit
BUILDER TRACK
build the tree yourself
- b1Your first driver tree
- b2The three patterns
- b3Leading indicators and the playbook
- b4Ecommerce deep dive
- b5Marketing deep dive
- b6Branding deep dive
- b7Internet and traffic deep dive
- b8B2B SaaS deep dive
- b9B2G deep dive
- b10Capstone: diagnose the drop
SEC-02 WHY A NUMBER NEEDS A TREE
A top-line number tells you that something happened. It cannot tell you what, and it cannot be assigned to anyone.
A branch that nobody owns cannot be actioned, and a branch that does not reconcile with its parent lets the diagnosis hide. Session b1 breaks one tree in the simulator until naming the guilty driver is a reflex, because reading a tree under pressure is a different skill from drawing one.
SEC-03 THE THREE PATTERNS
In a product, one driver moving 10 percent moves the top line 10 percent. In a sum it moves it by its share. In a bridge the question is never the level at all, it is what came in and what left.
SEC-04 THE BUILDER LADDER
Rung 1 gives you one tree and breaks it until naming the guilty driver is a reflex. Rung 2 gives you the vocabulary for every other metric. Rungs 4 to 9 are the same skill in six different rooms, which is the point: the tree travels, the domain knowledge is what you bring.
SEC-05 SIX DOMAINS, ONE SKILL
commerce2
- ecommerce
- B2B SaaS
- carts, pipeline,
- retention
demand2
- marketing
- branding
- spend, reach,
- and the lag
reach2
- internet, traffic
- B2G
- sessions, cycles,
- non-sales outcomes
The mechanics are identical in every domain. What changes is which drivers exist, how fast they respond, and how long the lag is before a lever shows up in the top line. Seeing the same tree in six rooms is what stops it being an ecommerce trick.